Let's begin the game: Technical Analysis
To trade in the forex market successfully you should forecast price behavior on the chart. One of the instruments for this kind of job is technical analysis. Technical analysis is a method of price movement forecasting on the base of price movement history. Studying movement history where the price will go in future. As you may have guessed the main object of technical analysis is a currency rates history or price movement chart. The price movement chart is built on axes where the vertical axis shows a price and the horizontal axis shows time.
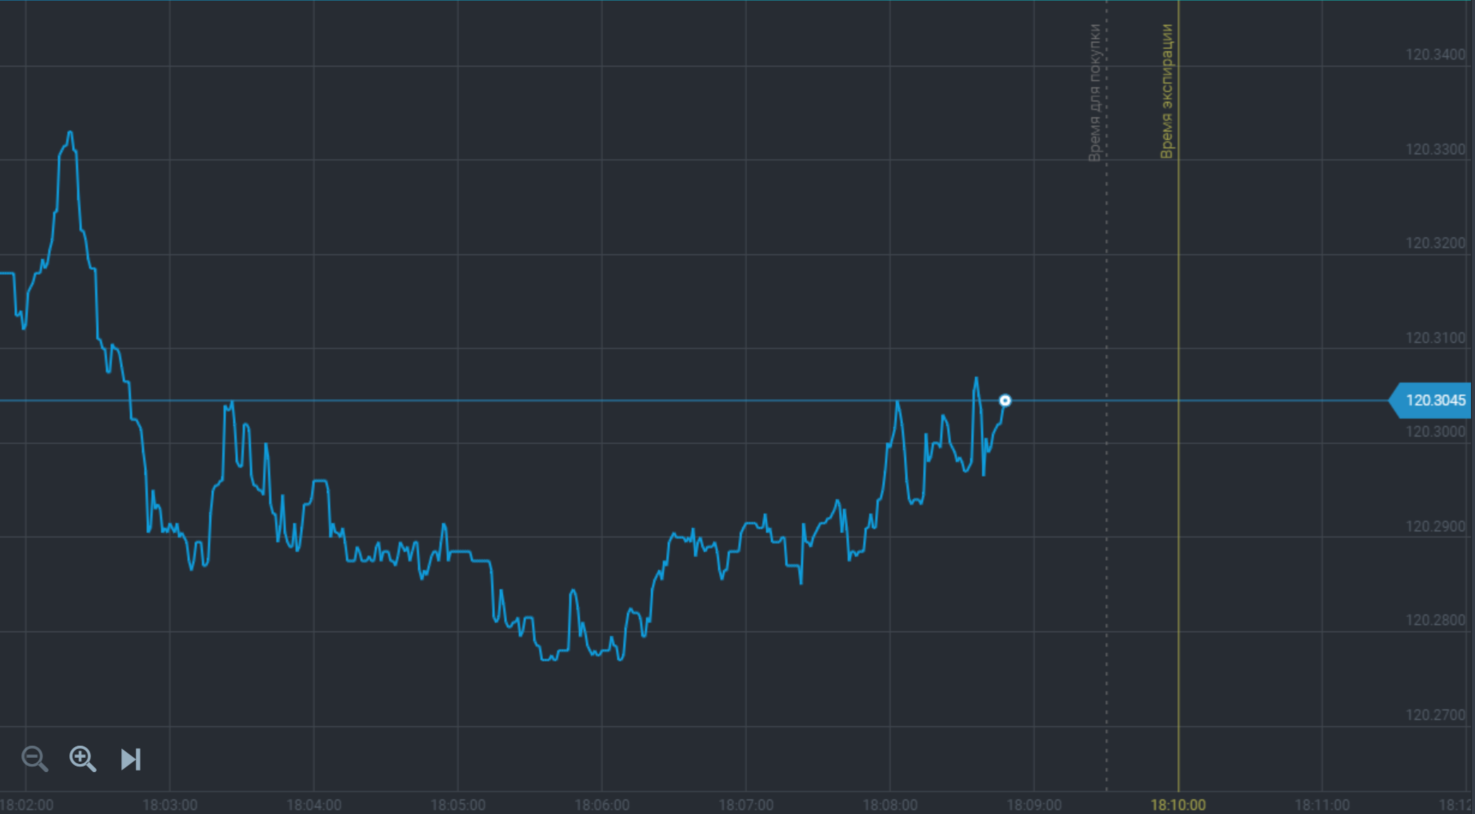
There are some price types where you can find some repeating patterns. If you have studied and remembered them you will be able to forecast charts based on building method and time intervals. At first let us review the difference of charts based on building method. The simplest one is a line chart which displays price changes in single prices connected with a line. These prices are fixed on the chart when time interval ends and each new price is connected by a line with a previous price. It looks as follows:
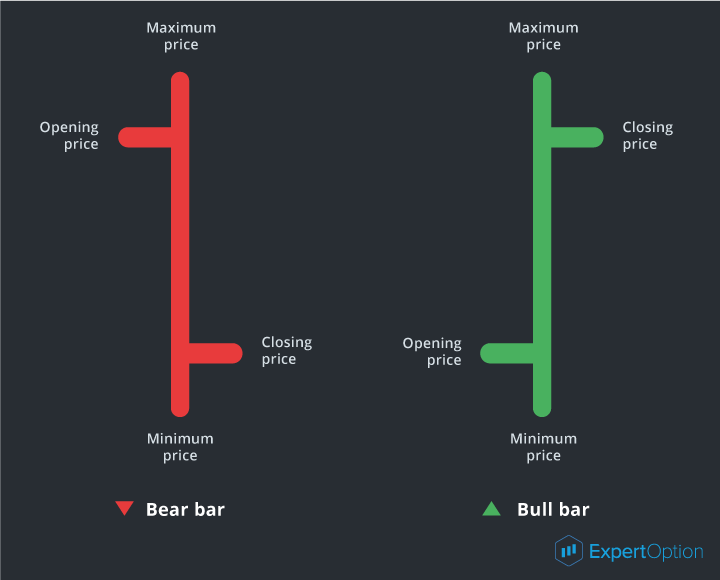
The following type is a bar chart. This chart is made of bars which show the price at the beginning of time interval (opening price), maximum and minimum prices within this period and the price at the end of time interval (closing price). Here is the example of price bars:
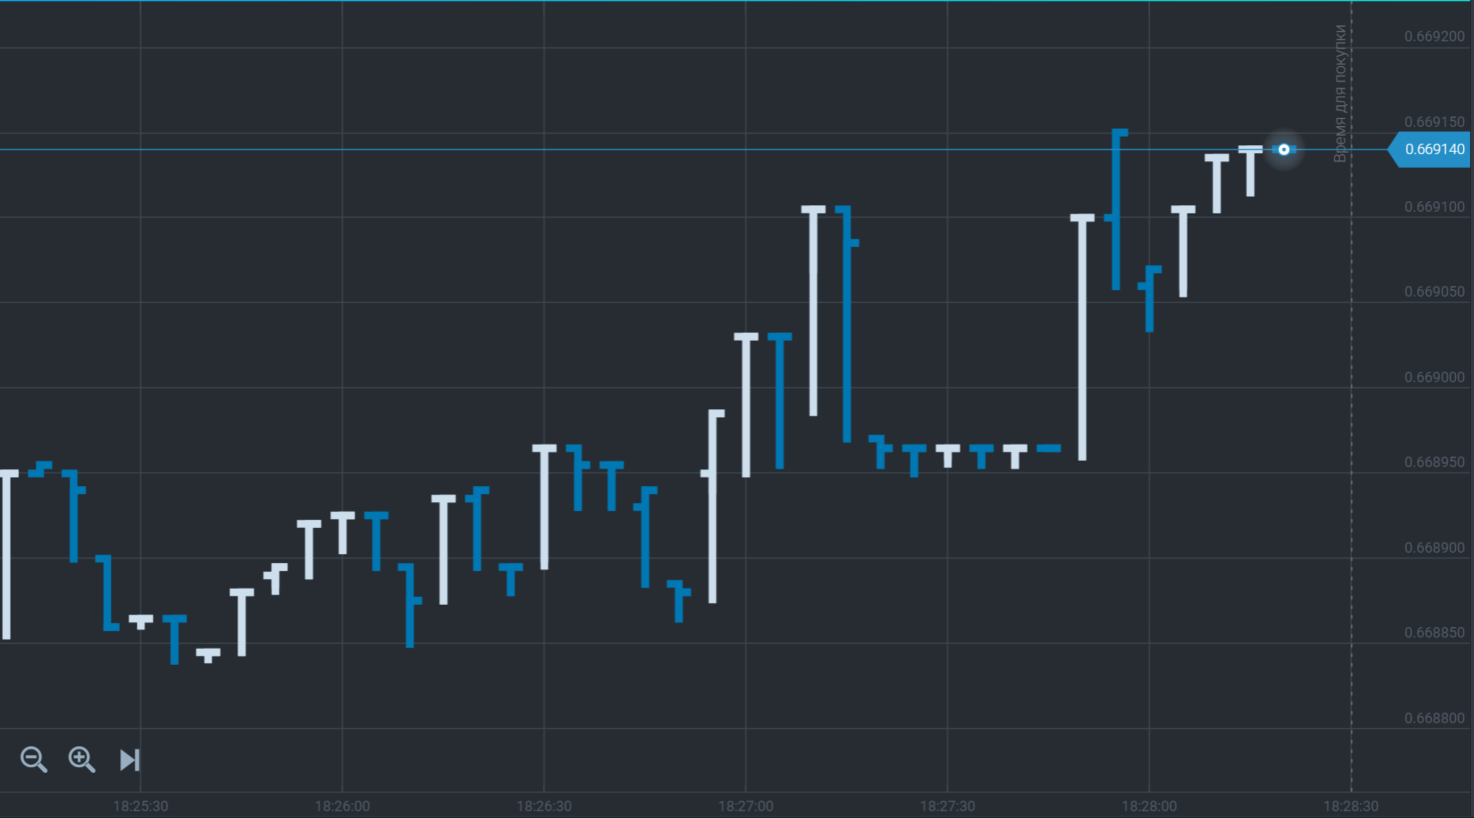
The bar chart looks as follows:
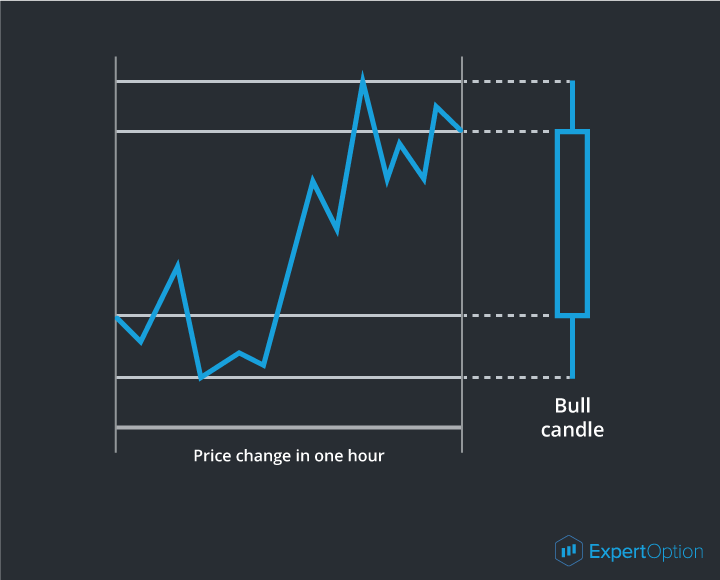
The third chart is a candlesticks chart. A candlesticks chart shows the same price information as a bar chart, but in prettier and easier format. All that because it is made of rectangles called as candlestick bars. Here is the example of candlestick bars:
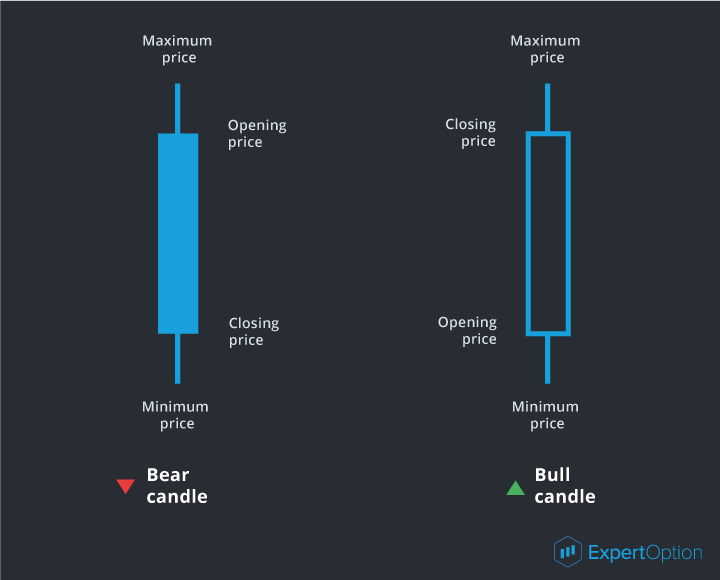
Where a bear candle indicates the price falls, and a bull candle shows the price raises. A candlesticks chart will look as follows:
So as we see, there are three types of charts: line, bar and candlesticks charts. Also the charts are recognized according to time period: 1 minute, 5 minutes, 15 minutes, 30 minutes, 1 hour, 4 hours, a day, a week and a month. Time period is the time interval when price was fixed on the chart. For example, if time interval is 1 hour, on the chart we will see a bar or candle indicating price at the beginning of an hour, maximum and minimum prices within this hour and price at the end of an hour. Here is the example:
Changing intervals of the charts you can do analysis of price history on every time intervals.
Technical Analysis is what you need
So, what the technical analysis is? The technical analysis uses charts to study the price history and find patterns. To use the price movement history for analysis we need to know three rules (axioms) of technical analysis:
1) Price moves forward – price change is always forward, whether price raises or drops, and it has its period. This axiom is a basis of tendency (trend) analysis and has the following conclusions: a current direction of price movement in the market most probably will continue rather than stop; and price will be moving in one direction until it becomes flat.
2) History repeats – if the price level was reached before it can be reached again in future. The same goes to price behavior graphical models which can appear in future with the same results as in the past. Studying the history of these price movement patterns gives us an opportunity more likely to foresee the further movement direction;
3) Price considers everything – any event affecting on currency price (political, economic and natural) is included into the price and it raises or drops depending on positive or negative affect of this event.
So thanks to basic rules of the technical analysis we can more likely forecast the price movement, determine its direction and period of this direction. It is necessary to understand that the market does not always follow the patterns found in the price movement history. Such unusual situations may happen, but with each new experience the trader will be able to find more predictable situations and make more precise estimation. For this very reason you should understand that if you have less experience you will use the most visible and prominent price movement patterns better to receive a maximum result. Technical analysis is not a science but it is more likely an art. And if a beginning trader is more attentive and hardworking he has more chances to receive a desired result.
Please refer to Section to learn more about Technical Analysis
Wow, cool post. I’d like to write like this too – taking time and real hard work to make a great article… but I put things off too much and never seem to get started. Thanks though. Easy Day Trading Strategy
ReplyDeleteThis content is written very well. Your use of formatting when making your points makes your observations very clear and easy to understand. Thank you. is etoro safe
ReplyDelete