Showing posts with label pattern. Show all posts

Saturday, 22 July 2017

3 Ways to Keep Your Confidence During Trading Slump

Thinking about Keeping up your confidence during trading , we will help you do it.
Slumps are inevitable in trading. They come with the market’s ever-changing environment, and even successful traders go through them.so how to keepup confidence during trading ?

I once heard a story about a trader who went through 48 months in a row without having a single negative month. On average, he made about $2,000 a day during this period. And then all of a sudden his streak came to an end and he went through a long slump wherein he couldn’t string together two profitable months in a row.

In such stressful times, it’s very easy to beat yourself up, focus on what you’re doing wrong, and overlook the things you’ve been doing right. It’s part of human nature!
[caption width="300" align="alignnone"]Confidence During Trading Confidence During Trading[/caption]
It can be argued that being hard on yourself is a way of addressing your problems. But it can become more of a bane than a boon to your trading if you get caught up in all the pessimism.

When the mind is zoned in on all the negative aspects of your trading, there’s a tendency to lose sight of the positive aspects that brought you success in the past.

It’s for this reason that I believe it’s better to focus your attention on banking on your strengths in times when you’re in a slump. Go back to the basics, as they say!

On the flipside, when you’re trading well, your attention should be shifted to the improvements that you can still make.

Doing so will help keep your trading confidence at proper levels. Remember, having low confidence can be just as bad for you as being overconfident!

Here are some steps you can take to stay positive during a trading slump:
1. Don’t simply dwell on the problem. Act on it.

As I mentioned in one of my articles about correcting bad trading habits, you should try to be more conscious of your trade decisions.

You can do this by talking out loud while trading or by journaling your trade decisions. Taking note of your thoughts and feelings during a trade can help you identify what you’re doing wrong so that you can work on cutting those bad habits later on.
2. Review those trades that worked well for you.

Having a detailed trading journal should come in handy at this point so I sure hope you have one!

By keeping track of the proper trade decisions you’ve made and the profitable setups you’ve taken, you’ll be able to identify which ones are effective for you. Also, reminding yourself that you were able to catch some good moves in the past would serve as a nice boost for your ego.
3. Find your trading niche.

Niche trading is all about specializing and focusing on what works well for you. You see, some traders aren’t able to perform well because there’s a mismatch between their personalities and their trading styles.

To avoid this, ask yourself the following questions:

What am I good at?
What are my strengths and weaknesses as a trader?
What are the qualities that can make me successful?

You might also want to take our Personality Quizzes in the School of Pipsology to help you find the answers to questions such as the following: Which currency pair should I trade? Which trading style is best for me? What kind of mechanical system suits my personality?

Bear in mind that one of the biggest challenges in trading is to stay focused and positive, even when your account balance is turning negative.

By making sure that your confidence remains intact, you’ll have a better chance of making it out of a slump. Remember to focus on the process and not solely on the profits.
Saturday, 1 July 2017

Easy Technical Analysis of stocks and forex

Let's begin the game: Technical Analysis


To trade in the forex market successfully you should forecast price behavior on the chart. One of the instruments for this kind of job is technical analysis. Technical analysis is a method of price movement forecasting on the base of price movement history. Studying movement history where the price will go in future. As you may have guessed the main object of technical analysis is a currency rates history or price movement chart. The price movement chart is built on axes where the vertical axis shows a price and the horizontal axis shows time.

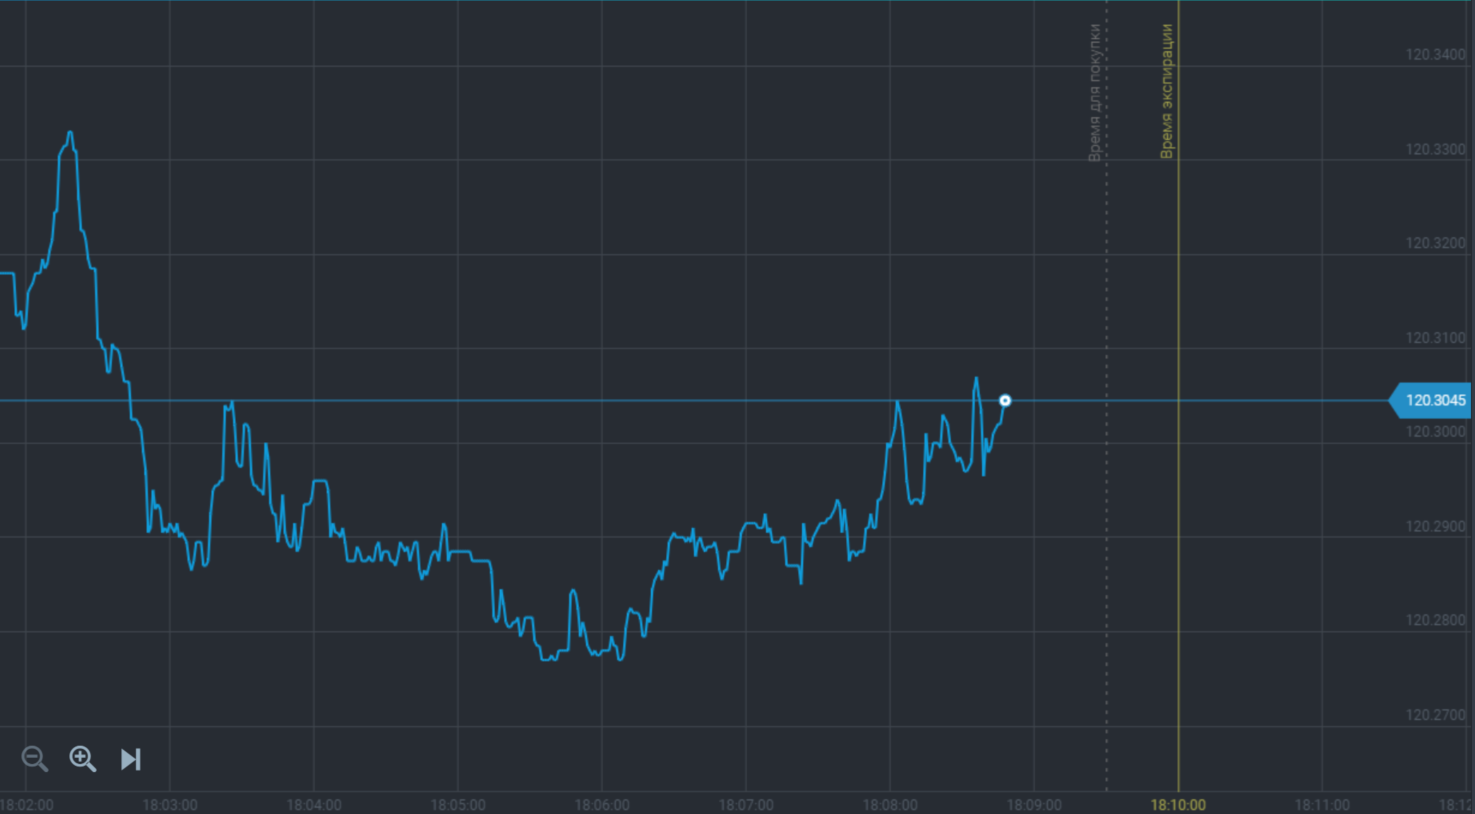
There are some price types where you can find some repeating patterns. If you have studied and remembered them you will be able to forecast charts based on building method and time intervals. At first let us review the difference of charts based on building method. The simplest one is a line chart which displays price changes in single prices connected with a line. These prices are fixed on the chart when time interval ends and each new price is connected by a line with a previous price. It looks as follows:

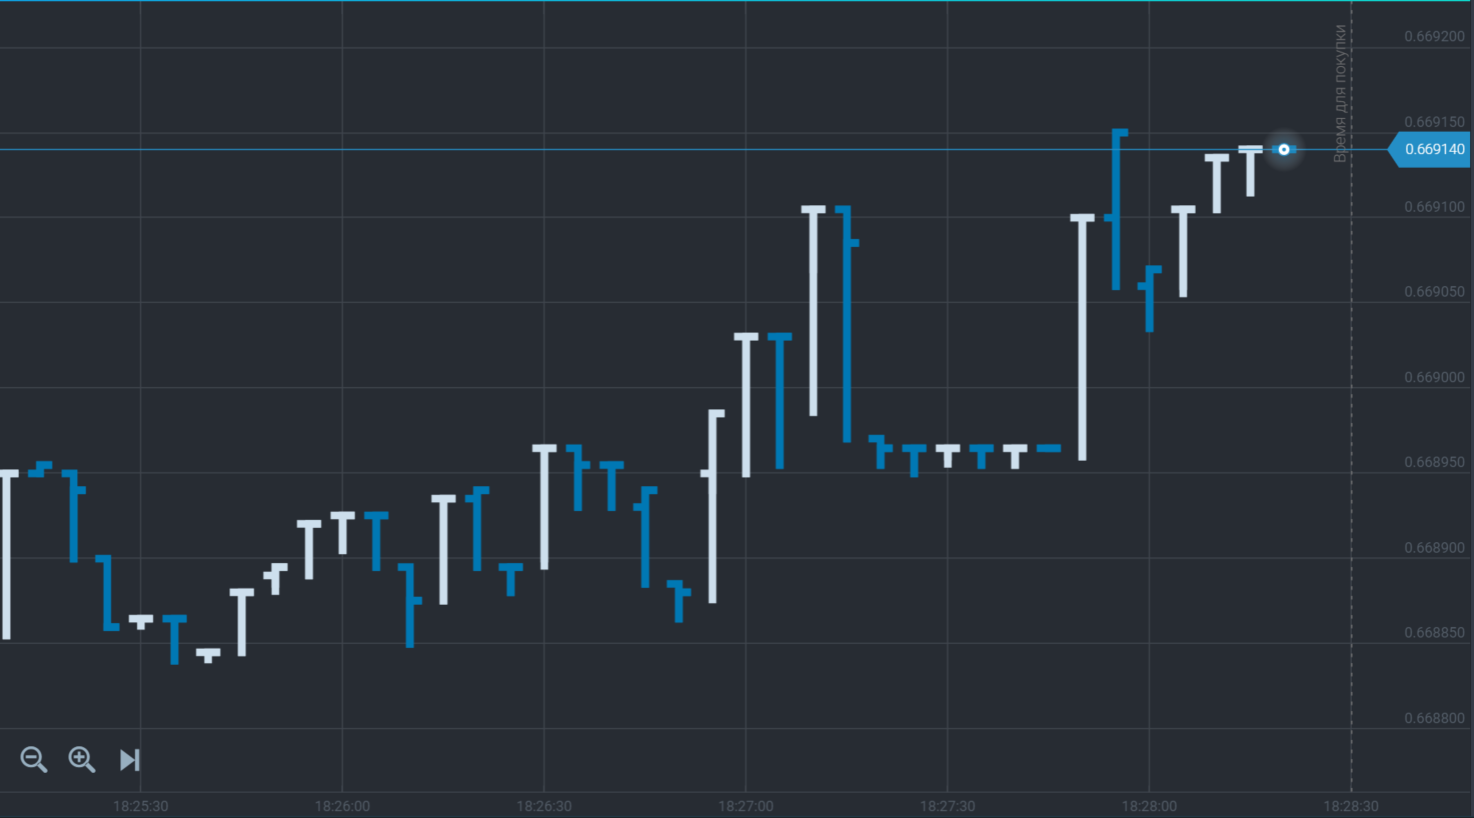
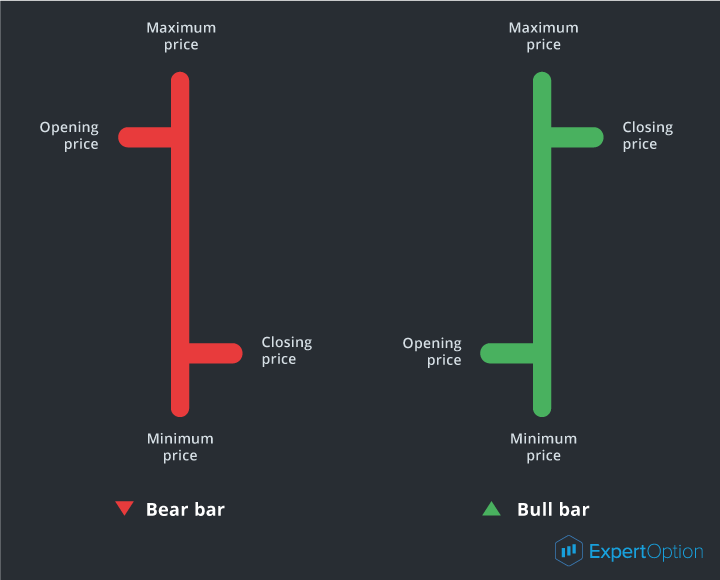
The following type is a bar chart. This chart is made of bars which show the price at the beginning of time interval (opening price), maximum and minimum prices within this period and the price at the end of time interval (closing price). Here is the example of price bars:

The bar chart looks as follows:

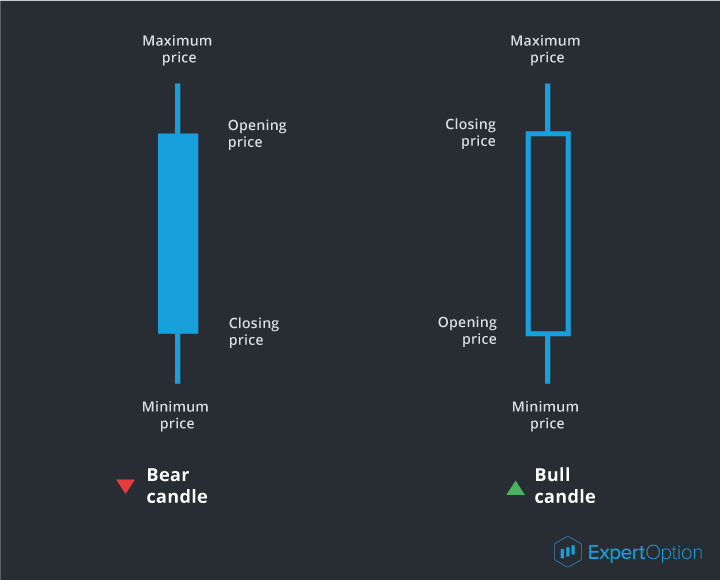
The third chart is a candlesticks chart. A candlesticks chart shows the same price information as a bar chart, but in prettier and easier format. All that because it is made of rectangles called as candlestick bars. Here is the example of candlestick bars:

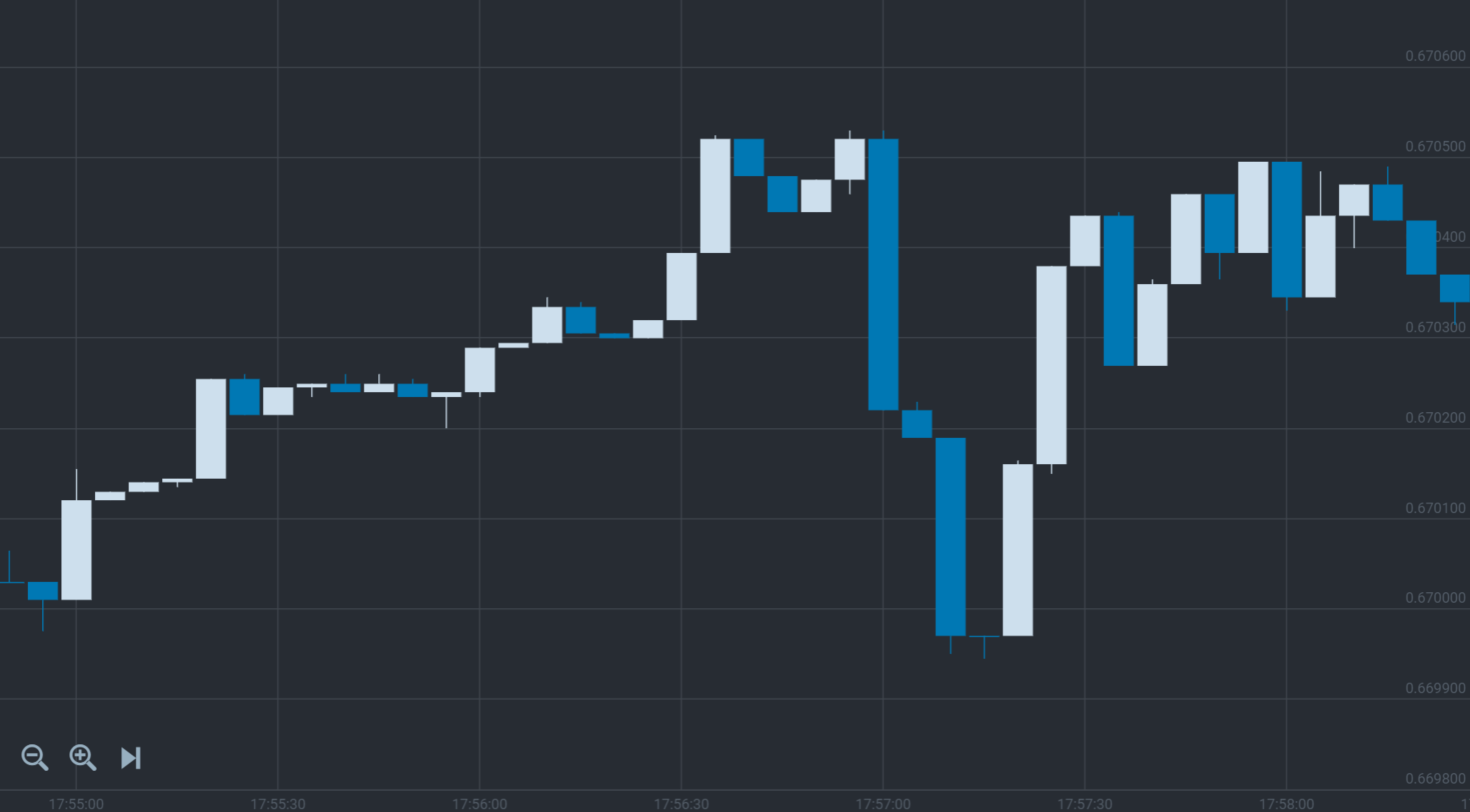
Where a bear candle indicates the price falls, and a bull candle shows the price raises. A candlesticks chart will look as follows:

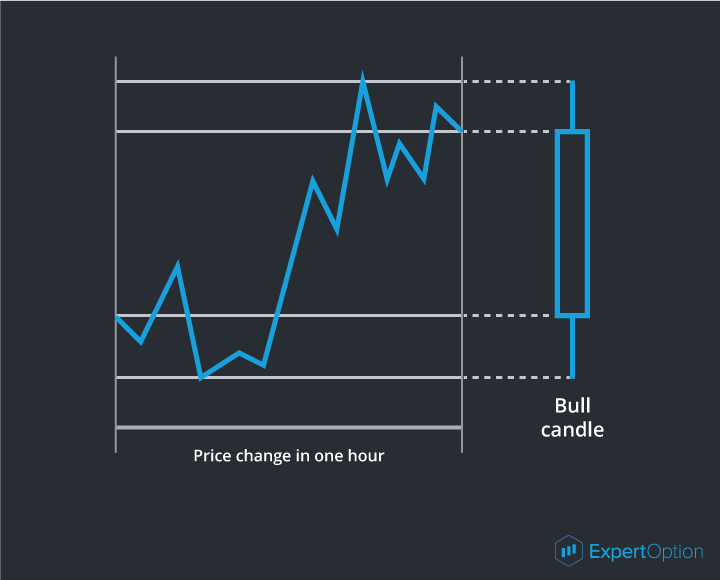
So as we see, there are three types of charts: line, bar and candlesticks charts. Also the charts are recognized according to time period: 1 minute, 5 minutes, 15 minutes, 30 minutes, 1 hour, 4 hours, a day, a week and a month. Time period is the time interval when price was fixed on the chart. For example, if time interval is 1 hour, on the chart we will see a bar or candle indicating price at the beginning of an hour, maximum and minimum prices within this hour and price at the end of an hour. Here is the example:

Changing intervals of the charts you can do analysis of price history on every time intervals.

Technical Analysis is what you need


So, what the technical analysis is? The technical analysis uses charts to study the price history and find patterns. To use the price movement history for analysis we need to know three rules (axioms) of technical analysis:

1) Price moves forward – price change is always forward, whether price raises or drops, and it has its period. This axiom is a basis of tendency (trend) analysis and has the following conclusions: a current direction of price movement in the market most probably will continue rather than stop; and price will be moving in one direction until it becomes flat.

2) History repeats – if the price level was reached before it can be reached again in future. The same goes to price behavior graphical models which can appear in future with the same results as in the past. Studying the history of these price movement patterns gives us an opportunity more likely to foresee the further movement direction;

3) Price considers everything – any event affecting on currency price (political, economic and natural) is included into the price and it raises or drops depending on positive or negative affect of this event.

So thanks to basic rules of the technical analysis we can more likely forecast the price movement, determine its direction and period of this direction. It is necessary to understand that the market does not always follow the patterns found in the price movement history. Such unusual situations may happen, but with each new experience the trader will be able to find more predictable situations and make more precise estimation. For this very reason you should understand that if you have less experience you will use the most visible and prominent price movement patterns better to receive a maximum result. Technical analysis is not a science but it is more likely an art. And if a beginning trader is more attentive and hardworking he has more chances to receive a desired result.


Please refer to Section to learn more about Technical Analysis

Wednesday, 28 June 2017

Easy Bollinger Bands Candlestick Pattern explained

Bollinger Bands Candlestick Explained


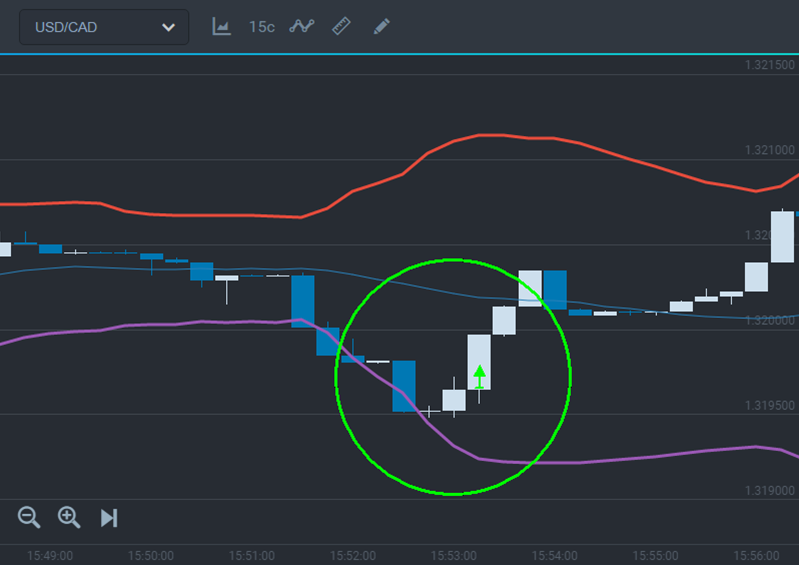
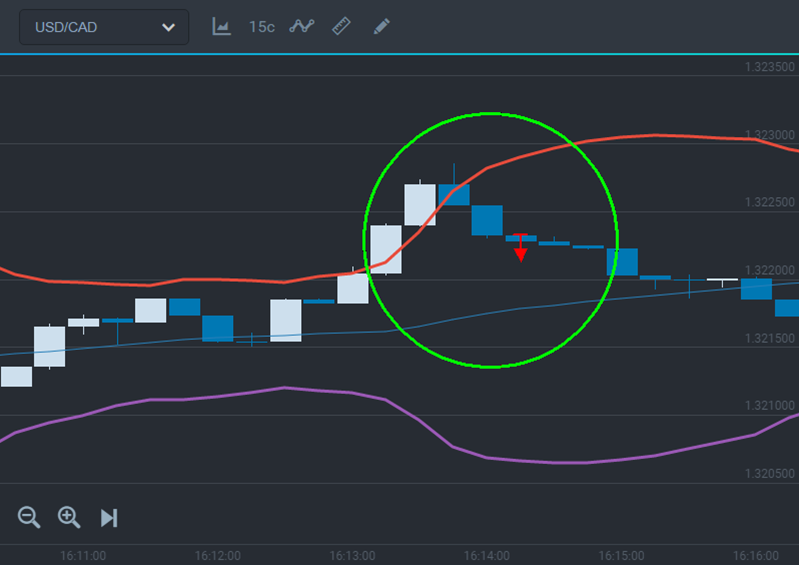
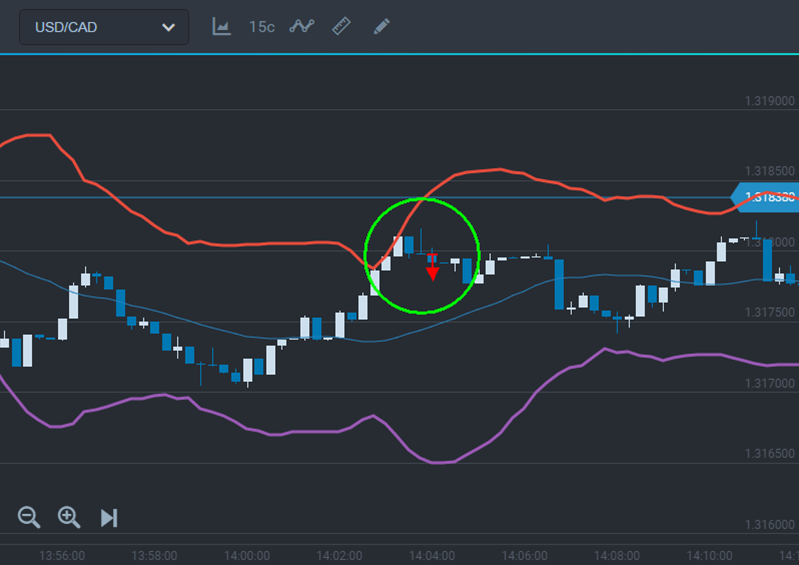
Bollinger bands are easy to use and can replace trend channels as the indicator shows the range where the price mostly moves. Working with Bollinger bands you can use a signal: when the price sharply breaks the band it tends to return back to the central indicator line.


A procedure after a signal appearance:

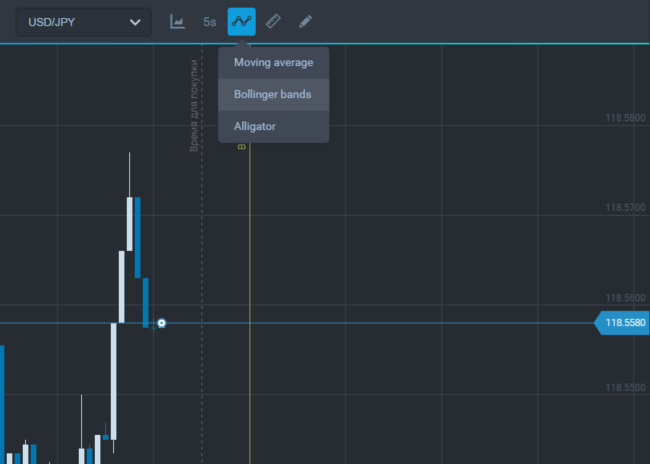
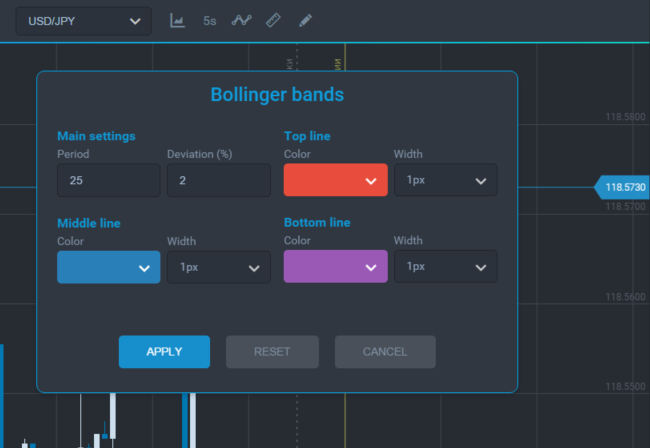
1) Add BB indicator to the price chart;

Add an Indicator

ndicator Settings

2) Wait when the price has moved outside the indicator;

3) After the price has returned inside and a confirming candlestick has been closed we can open a deal directed towards the central indicator line;

Buying a call after the lower band breakout

Buying a put after the upper band breakout

The upper and lower Bollinger bands can be used as the levels of support and resistance.

A procedure after a signal appearance:

1) The price is closed at the upper/lower indicator line;

2) A new candlestick moves in reverse direction;

3) Wait for a confirmation and buy an option directed towards a central indicator line.Buying a put after bounce off the upper band – resistance line

Rising and Falling Three Methods Candlestick Pattern

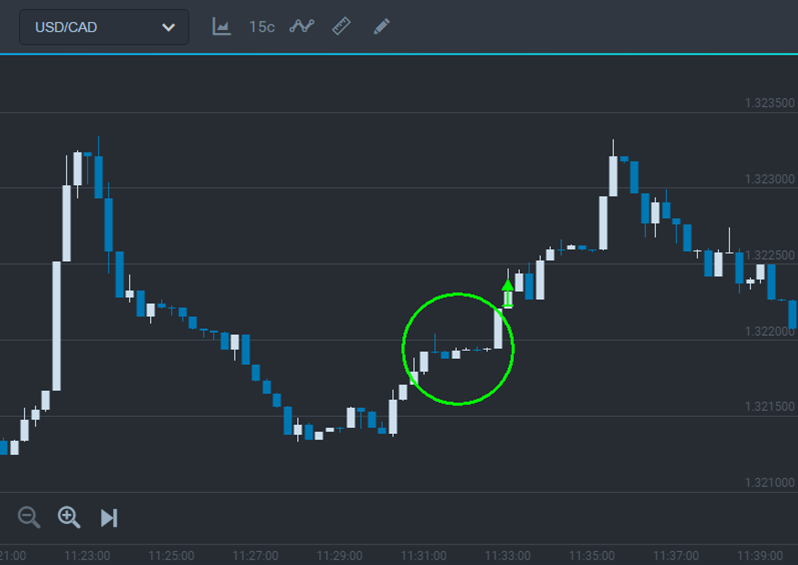
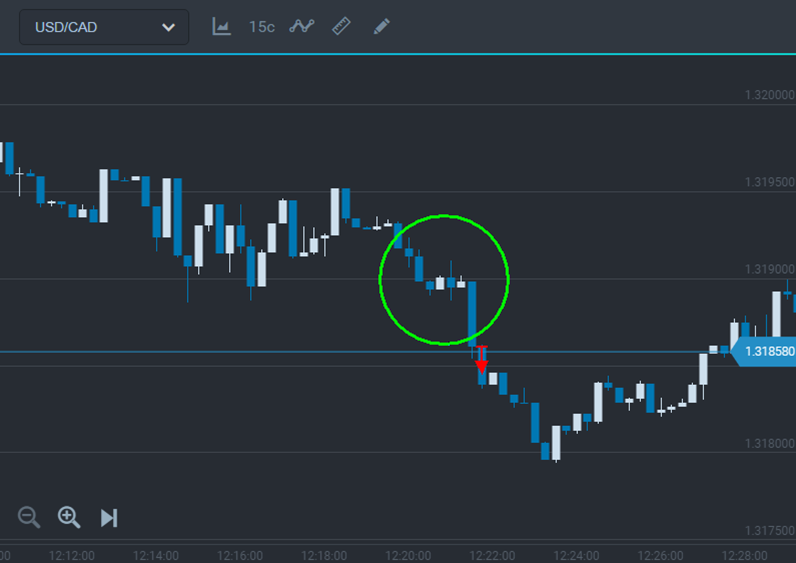
The three methods continuation signal appears during a pause in trend development. On the chart it is formed by some small candlesticks appeared after a big candlestick. A main feature of this formation will be some new small candlesticks within a range of the previous candlestick size. There can be three or more candlesticks. A big candlestick in the trend direction will form the end of the model and give a continuation signal. You should start trading after closing this candlestick.

A procedure after a signal appearance:

1) When small candlesticks appear after a strong candlestick in a tendency direction you should be prepared to open a deal;

2) A big candlestick continuing a tendency appears;

3) After closing this candlestick buy an option in its direction.

Buying a call after bullish 3-method formation

Buying a put after bearish 3-method formation

As you can see on the pictures the 3-method formation reminds such technical analysis patterns as a flag or pennant.


DEFINITION of 'Falling Three Methods'


A bearish candlestick pattern that is used to predict the continuation of the current downtrend. This pattern is formed when the candlesticks meet the following characteristics:

1. The first candle in the pattern is a long red candlestick within a defined downtrend.
2. A series of ascending small-bodied candlesticks that trade within the range of the first candlestick.
3. A long red candlestick creates a new low, which suggests that the sellers are back in control of the direction.

BREAKING DOWN 'Falling Three Methods'

The series of small-bodied candlesticks are regarded as a period of consolidation before the downtrend is able to continue. This pattern is important, because it shows traders that buyers still do not have enough conviction to reverse the trend and it is used by some active traders as a signal to add to their short positions.

Rising Three Methods


A bullish candlestick pattern that is used to predict the continuation of the current uptrend. This pattern is formed when the candlesticks meet the following characteristics:

1. The first candle in the pattern is a long white candlestick within a defined uptrend.
2. A series of descending small-bodied candlesticks that trade within the range of the first candlestick.
3. A long white candlestick creates a new high, which suggests that bullish are back in control of the direction.

BREAKING DOWN 'Rising Three Methods'


The series of small-bodied candlesticks are regarded as a period of consolidation before the uptrend is able to continue. This pattern is important because it shows traders that sellers still do not have enough conviction to reverse the trend and it is used by some active traders as a signal to add to their positions.

Monday, 26 June 2017

Tweezers Candlestick Pattern for Trend Traders

Another strong reversal signal is a tweezers candlestick pattern. Tweezers are two candlesticks in reverse direction and having the same maximums or minimums: at descending tendency tweezers candlesticks have the same minimums and at ascending tendency they have the same maximums. Minimums and maximums of the tweezers can be the closing prices or candlestick shades. The candlesticks of formation can appear one by one or have the other candlesticks between them. This is a strong signal that can strengthen or be strengthened by the other candlestick formations.

A procedure after a signal appearance:

1) If you see the candlesticks with the same minimums or maximums on the chart be prepared for a reversal price movement;

2) After closing the candlestick having formed tweezers buy an option in the changed direction.

Buying a call after tweezers formation

Tweezers with bullish engulfing

As the tweezers formation gives a strong signal it is not necessary to wait for a confirmation especially if it forms at the levels of support or resistance. But if you are not sure as for a current market situation you can wait for a new candlestick and see its direction. A signal confirmation mostly helps you to save your profit.

Pin-Bar or squat candlestick Pattern

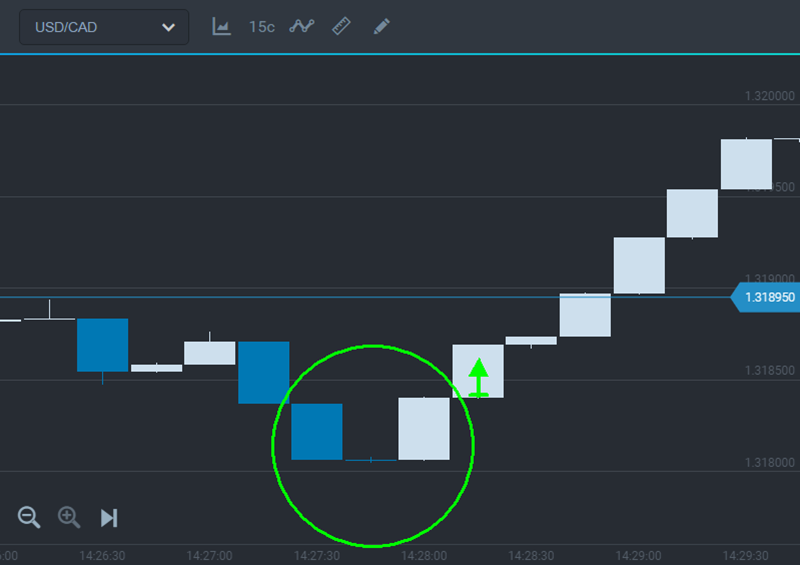
Squat candlesticks often show a tendency reversal. Usually they tell about uncertainty of a current market direction. The squat candlesticks mostly appear at the price levels. There can be one or some such candlesticks. If you see a candlestick with a small body and long shade you should be prepared for the current tendency reversal.

A procedure after a signal appearance:

1) If you see a squat candlestick has appeared be prepared to open a deal;

2) A squat candlestick is followed by a new reversal candlestick;

3) After closing a new candlestick open a deal in its direction.


Buying a call after a squat candlestick

If you see a tendency continuation after appearance of the squat candlestick you should consider the signal to be canceled. As in a case of engulfing pattern we should wait for closing a new candlestick following the squat candlestick to confirm a reversal.

Remember there can be some squat candlesticks in a raw and all of them will signalize about market uncertainty. You can study many squat candlestick patterns from the books on candlestick analysis.

How to utilize candlestick Engulfing Candlestick Pattern

Engulfing Candlestick Pattern :
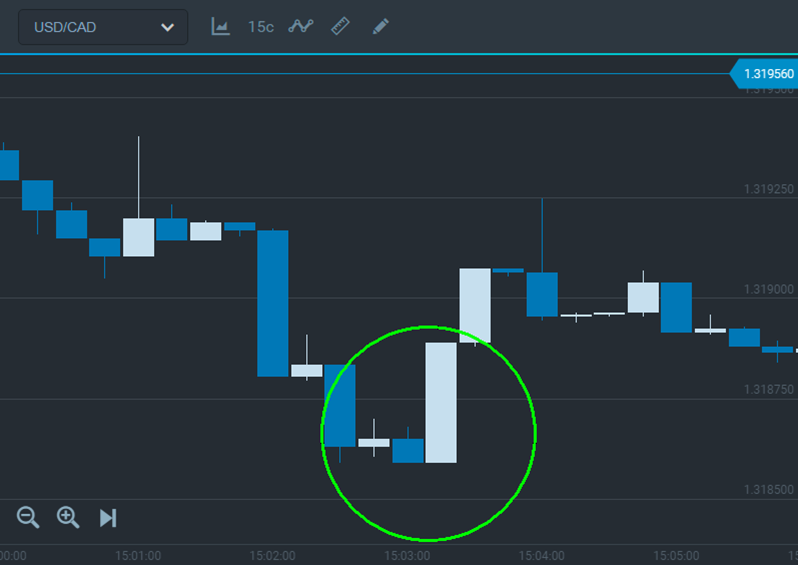
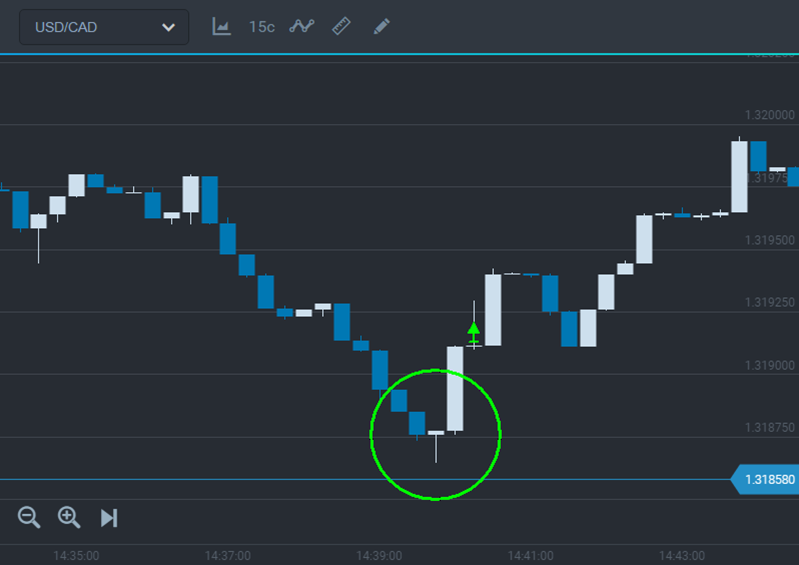
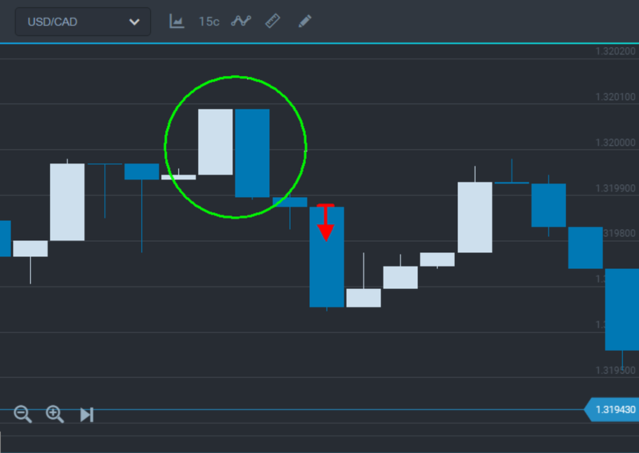
This pattern signalizes about reversal of the price movement. We see this signal after a candlestick has appeared and its body is bigger than the previous reversal candlestick. This is an engulfing candlestick. When this signal appears we should be prepared and see where the next candlestick will move. If the candlestick has the same direction as an engulfing pattern you can open a deal after its closing.

A procedure after a signal appearance:

1) See a bigger candlestick in opposite direction to a previous candlestick;
https://expertoption.com/?refid=15234
2) Wait for appearance of a new candlestick confirming a direction;

3) Open a deal in the engulfing direction after closing a new candlestick.


Buying a put after a bearish engulfing pattern

The bigger engulfing candlestick is the stronger price movement will be after reversal. In this case if you have some profit you can risk and buy an option after closing a strong engulfing candlestick. But remember you should always wait for confirmation of candlestick signals.


What is a 'Bullish Engulfing Pattern'

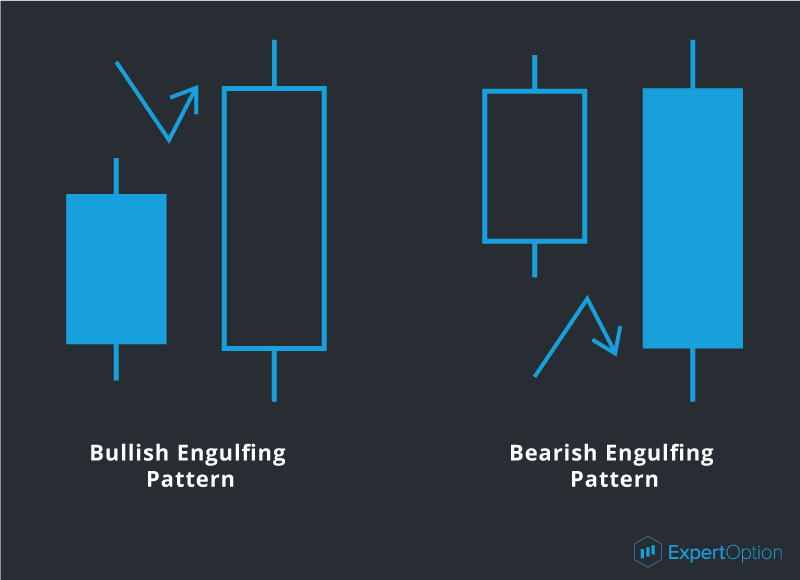
A bullish engulfing pattern is a chart pattern that forms when a small black candlestick is followed by a large white candlestick that completely eclipses or "engulfs" the previous day's candlestick. The shadows or tails of the small candlestick are short, which enables the body of the large candlestick to cover the entire candlestick from the previous day.
Bullish Engulfing Pattern
BREAKING DOWN 'Bullish Engulfing candlestick Pattern'
As implied in its name, this trend suggests the bulls have taken control of a security's price movement from the bears. This type of pattern usually accompanies a declining trend in a security, suggesting a low or end to a security's decline has occurred. However, as usual in candlestick analysis, the trader must take the preceding and following days' prices into account before making any decisions regarding the security.

Bullish engulfing candles indicate immense buying interest that swallows the range of the prior candlestick low and surpasses the candlestick highs. The buying action is frenzied as the candle usually closes at its highs with little to no upper wick. This in turn triggers more buyers who spill over into the next candle. If the next candle closes higher than the bullish engulfing pattern, the next leg of the uptrend usually forms.
Bullish Engulfing Candle Reversals

Where a bullish engulfing candle forms in the context of a trend is one of the most important factors. When a bullish engulfing candle forms at the end of a downtrend, the reversal is much more powerful as it represents a capitulation bottom. The lows of the candle should be the low of the downtrend. This is usually preceded by a minimum of four consecutive lower low candles prior to the bullish engulfing candle, which should close near the candle highs. When the next candle closes above the bullish engulfing candle, it forms a market structure low trigger, which is the high of the proceeding candlestick. When that high is broken, then an official trend reversal forms.

For example, if XYZ is in a downtrend that has shown five consecutive lower candle closes at 25.20, 25, 24.80, 24.70 and 24.60, then it forms a bullish engulfing candle with a low of 24.30 that bounces and closes at 24.80. The next candle has a high of 25 and closes at 24.95. This sets up the market structure low trend reversal trigger if 25 can break, which is the high of the prior candle. In this case, the stock breaks 25 to trigger a surge that spikes the stock up to 25.30 and reverses XYZ back into an uptrend. The bullish engulfing candle reversal is much stronger than a typical hammer type reversal since the body completely engulfs the prior candle indicating a buying frenzy.

What is a 'Bearish Engulfing Pattern'

A bearish engulfing pattern is a chart pattern that consists of a small white candlestick with short shadows or tails followed by a large black candlestick that eclipses or "engulfs" the small white one. As implied by its name, a bearish engulfing pattern may provide an indication of a future bearish trend.
Bearish Engulfing Pattern
BREAKING DOWN 'Bearish Candlestick Engulfing Pattern'
This type of pattern usually accompanies an uptrend in a security, possibly signaling a peak or slowdown in its advancement. However, whenever a trader analyzes any candlestick pattern, it is important for him, before making any decisions, to consider the prices of the days that precede and follow the formation of the pattern.

A bearish engulfing pattern is seen as the end of an upward trend, marked by the primary candle of upward momentum being overtaken, or engulfed, by a larger secondary candle indicating a shift toward a downtrend. This is particularly relevant when the secondary opening price is higher than the primary price. Additionally, the further down the secondary candle goes, beyond the lower edge of the primary candle, the more significant the downward trend indicator.

This information is used in hopes of anticipating a change in market conditions. If a bearish engulfing pattern is present, an investor focused on short-term gains may choose to sell the particular security if he believes prices will continue to fall, allowing him to move his investments toward a security showing growth potential. Long-term investors may not choose to sell the security, as a bearish engulfing pattern is not a guarantee of a long-term downward trend.
Understanding Candlestick Charts

A candlestick is composed of three points: the open, the close and the wick. The open and close points represent the opening and closing prices, respectively, of a particular security. If the open point is below the close point, this notes an upward trend, often shown in white or blue when charted. If the open point is higher than the close, this indicates a downward trend, often shown in black or red when charted. The wicks represent the most extreme price, one for the high and one for the low, paid for a particular security during the period being analyzed.
Bullish Engulfing Pattern

A bullish engulfing pattern is represented by the opposite of a bearish market, with an upward trend overtaking a previous downward trend within a candlestick chart. This may be an indicator a market shift is occurring and an upward trend is on the horizon.

Read more: Bearish Engulfing Pattern http://www.investopedia.com/terms/b/bearishengulfingp.asp#ixzz4niv3z6gV

Sunday, 25 June 2017

Breaking of Minimum and Maximum in Iqoption

This is a process in which in which we will find the minimum and maximum point of the current market scenario using Graphical tools like lines and Technical Tools like Moving Averages.this is also known as local level Breaking pattern.

According to this strategy you open a deal when the price breaks out the current level and continues its movement in the same direction. A deal should be opened after a candlestick body breaks out the level of support or resistance and a new candlestick moves in the same direction.


A procedure after a signal appearance:

1) The price chart has reached a support or resistance level;

2) Wait for appearance of the candlestick breaking out the level with its body and closing there;

3) Wait for appearance of a new candlestick moving in the breakout direction;

4) Buy an option in the breakout direction after closing a confirming candlestick.


Buying a put after breakout of the support level


Buying a put after breakout of the descending trend channel


Buying a call after breakout of the descending trend line

Using a breakout strategy you should always have a signal confirmation as breakout can be false. A false breakout of the level appears when the first candlestick breaks the level and the second candlestick returns back to opening price of the first candlestick.


Aspects of the false breakout:

1) A candlestick has broken the level with its shade and closed inside the level;

2) A candlestick has been closed at the level or a bit outside and a new candlestick returned to the range inside the level.


False breakout of the support level

If after breakout a reversal or squat candlestick has appeared this breakout can be false. In this case you should wait for a candlestick moving in the breakout direction and buy an option after its closing.