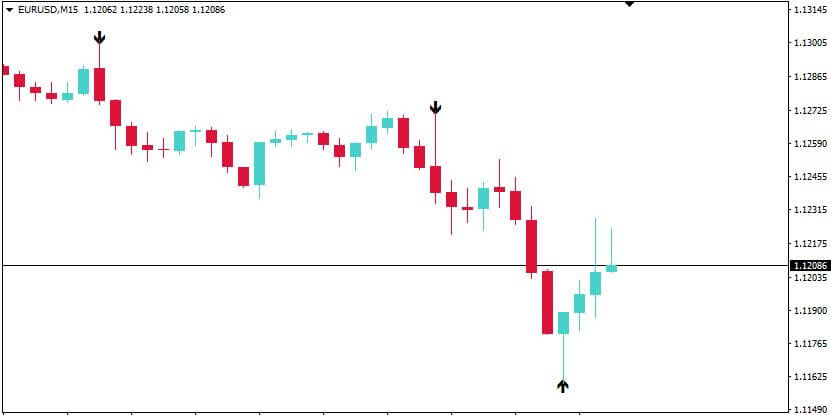
Trading using BOSTS_1 indicator is very simple, however it is not without risks. You may have seen this indicator before as it is usually a part of more complex strategies. According to our experiences, this indicator works using Bollinger bands. It is trend indicator, therefore you don’t need to use trends if you use BOSTS_1.
We, however, recommend to use manually drawn lines of support and resistance. This indicator repaints itself, therefore is more suitable only as a support indicator – not the main source of signals
We will trade according to arrows drawn by this indicator
How to setup the chart
Timeframe: M5 Template: BOSTS_1 (Download it here: ulozto.net)
Binary options strategies and their accuracy
Trading according to some strategies may be a good start on how to learn binary options trade. However, it is not recommended to use only simple indicators.
Always use your experience and gut feeling, in addition to indicators!
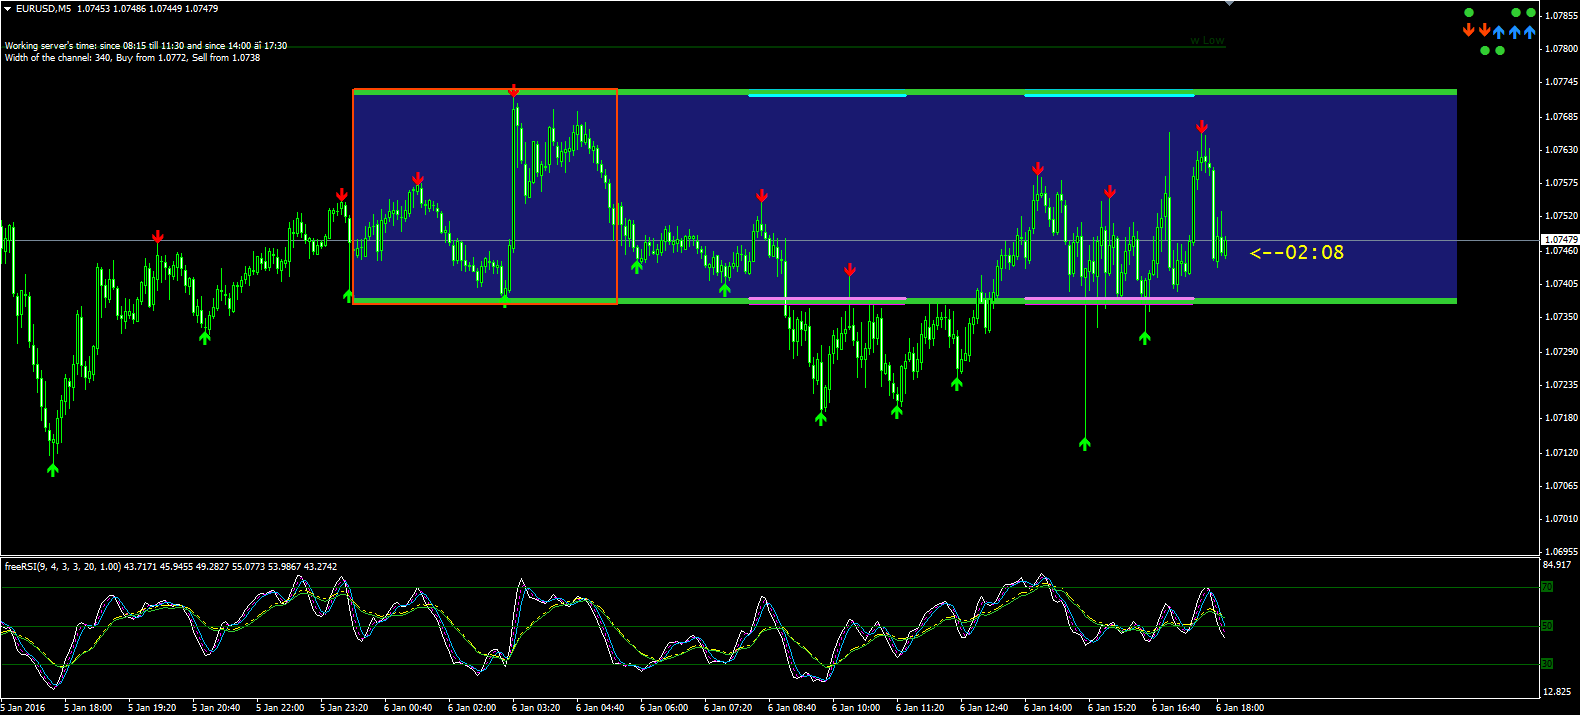
MARSI is a strategy that uses the lines of support and resistance. These are drawn automatically and we only need to pay attention when an arrow appears.
As soon as an arrow appears, we need to confirm that this is a real signal (The RSI indicator line is above or below 50, depending on the type of signal) – afterwards, open a trade for 3 times the timeframe. If you are using M5 timeframe, open a 15 minute trade. If you’re using M1 timeframe, the expiration time will be 3 or 5 minutes.
When to enter a trade
Entering a CALL trade:
Current candle is rising (black)
Green arrow is under previous candle
RSI indicator on current candle is below 50
Enterint a PUT trade:
Current candle is falling (white)
Red arrow is above previous candle
RSI indicator on current candle is above 50
Binary options MARSI strategy screenshots
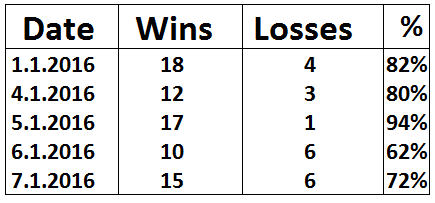
Our results with this strategy
We have tested this strategy for a couple of days and the success rate was 78 %, which is not bad at all. If you want, I recommend this strategy to you. You can have a look at more detailed statistics underneath.
Are you looking for a moving average strategy for binary options?
One of the easiest ways to trade the forex markets is by using a moving strategy. While this strategy may be simple, the moving average needs to be exponential. This ensures you accomplish the right trades sooner and you squeeze a little more out of the prices. You can improve this system by adding a moving average. In this way, you can measure extremes as well as get information from crossovers. Let’s look at a 30 bar exponential moving average to demonstrate and use 2 time frames, 30 minutes and daily. The moving average will be kept at 30 bars for both time frames.
We also have a similar strategy using MA, called the Rainbow Strategy:
Blue moving average is on top and golden is on the bottom.This strategy uses only one indicator and that is good old Moving Average which you may have already used and know about it. We will use three EMA (Exponential Moving Average) set to 6, 14 and 26 colored differently to determine the trend and […]
Why use a moving average?
Measuring average prices over a period of time is a excellent way to gauge market strength and the current trend. Moving averages allows you to do this and can also be used to create the basis for a technical analysis. Moving averages are also referred to as a rolling mean. When the moving average is plotted alongside current pricing, the data produced measures trend. When prices hit higher levels, the moving average escalates as well and decreases when prices close lower. To ensure the exponential moving average offers value as a current indicator, the older data has less weight than the newer information gained.
So how does it work?
Working on 2 separate time frames and an exponential moving average of 30 days you can begin to pick up trends. The longer time frame will show an underlying trend which can be used as a foundation. When you work on the daily time frame, you can see when the trend is bullish (above the moving average) or bearish (below the moving average). It is important to note, that while this is an indicator, other factors should be taken in to consideration such as the resistance, support and the long term trend. If the price has been above the moving average for quite some time and is nearing it’s long term resistance, be more cautious than if it has just moved above the resistance and is appearing to be on an upward trend.
Once you are sure of the underlying trend and you have ascertained that it is not about to reach a turning point, you can start working on a 30 minute bar chart. After around 10 days you would have a good view of support/resistance and the trend.
When the price moves above the 30 bar exponential moving average on the 30 minute chart, this would be your signal.
It can take quite a few hours to receive confirmation. Check the daily charts before continuing. Limit expiration from 1-4 hours. Signals may not also develop on a daily basis, but you may receive more than one in a single day. Your expiration will be shorter the closer the turning point seems to be. When the market is bullish, once the asset reaches above the 30 bar exponential moving average, this will be the signal to buy. You may miss the first signal and possibly take a loss on the final signal, but the signals in between should make up for it and help you achieve success.
This system works, it is a simple technical analysis which most traders in the current market place and often forms the basis for upper level, more complicate techniques. For amateur traders, this strategy is a good place to start. You need to learn the basics of technical analysis to understand the markets and a moving average system will help you with this skill. You should be able to achieve results on a consistent basis when you apply this strategy properly.
Iqoption & Binary Options Strategy Welcome to the part of our website dedicated solely to your education! No matter how experienced in trading binary options you might be, you will always be able to find useful tips and advice here to help you improve your chances. We want to help you find a way to create a perfect binary options strategy! Without any restrictions, you can browse dozens of educational articles divided into three categories because we here Tradfox.com always put our readers first. There is something for absolutely everyone here! Of course, new articles will be added on regular basis, so be sure to check this part of the website regularly if you want to expand your knowledge. But for now, allow us to show you what we offer.
Iqoptions & BINARY OPTIONS FOR BEGINNERS
If you’re new in this business, this is the category you should check out first. Here we analyze and explain the most basic terms and show you what to look out for at the beginning of your trading career. We will also show you how use all the most important tools, so that you can immerse yourself in trading without too much stress. In short, this is the category where we provide you with some extremely solid foundations upon which you can then start building your binary options strategy. Go through these articles and you will surely be able to achieve some success on the market. However, do remember that there is much more to learn about binary options, so you definitely shouldn’t stop with your education once you’re done with this category.
ADVANCED Iqoption BINARY OPTIONS
So, you’ve familiarized yourself with the basics? You don’t consider yourself to be a beginner anymore? Good, because there is much more to learn. This is the category where we start to show you just how complex this type of trading can get. We will show you the basic principles behind some of the more demanding tools and an advanced way to come up with your binary options strategy, so that you can scratch below the surface of the market and start thinking several steps ahead. These articles will broaden the range of solutions you have when you take a look at the latest market data. Of course, we still keep things nice and simple, thanks to our experts who know exactly which questions traders have when they reach this stage.
Iqoption and BINARY OPTIONS FOR EXPERTS
Want to become a pro and turn trading binary options from a side income to your main source of income? Great, these are the things you need to master. Go over them even if you consider yourself a trading expert because there are many details you need to be aware of at this level. Even the best traders can discover something new they are not familiar with, or they simply need to learn more about a particular subject. It all pretty much revolves around technical analysis at this stage, so we will give you more options to extract information from the way the market behaved in the past. This is where you get to see just how complex a binary options strategy can get, but don’t let that scare you – our experts will be with you every step of the way.
iqoption and Binary Options Strategy
Welcome to the part of our website dedicated solely to your education! No matter how experienced in trading binary options you might be, you will always be able to find useful tips and advice here to help you improve your chances. We want to help you find a way to create a perfect binary options strategy! Without any restrictions, you can browse dozens of educational articles divided into three categories because we here at BinaryOptionsTrading-Review.com always put our readers first. There is something for absolutely everyone here! Of course, new articles will be added on regular basis, so be sure to check this part of the website regularly if you want to expand your knowledge. But for now, allow us to show you what we offer. BINARY OPTIONS FOR BEGINNERS
If you’re new in this business, this is the category you should check out first. Here we analyze and explain the most basic terms and show you what to look out for at the beginning of your trading career. We will also show you how use all the most important tools, so that you can immerse yourself in trading without too much stress. In short, this is the category where we provide you with some extremely solid foundations upon which you can then start building your binary options strategy. Go through these articles and you will surely be able to achieve some success on the market. However, do remember that there is much more to learn about binary options, so you definitely shouldn’t stop with your education once you’re done with this category.
So, you’ve familiarized yourself with the basics? You don’t consider yourself to be a beginner anymore? Good, because there is much more to learn. This is the category where we start to show you just how complex this type of trading can get. We will show you the basic principles behind some of the more demanding tools and an advanced way to come up with your binary options strategy, so that you can scratch below the surface of the market and start thinking several steps ahead. These articles will broaden the range of solutions you have when you take a look at the latest market data. Of course, we still keep things nice and simple, thanks to our experts who know exactly which questions traders have when they reach this stage.
Pro Iqoption and Binary Options Trading
Want to become a pro and turn trading iqoption and binary options from a side income to your main source of income? Great, these are the things you need to master. Go over them even if you consider yourself a trading expert because there are many details you need to be aware of at this level. Even the best traders can discover something new they are not familiar with, or they simply need to learn more about a particular subject. It all pretty much revolves around technical analysis at this stage, so we will give you more options to extract information from the way the market behaved in the past. This is where you get to see just how complex a iqoption and binary options strategy can get, but don’t let that scare you – our experts will be with you every step of the way.
All of these articles have been written by our team of reliable iqoption and binary options experts. These people have been a part of this industry since its inception, but they also have significant experience with other types of trading. They know how exciting and profitable iqoption and binary options trading can be, and they also know about the dangers that lurk out there. That’s why they are the best source of information for you and why they started writing these articles in the first place. Our experts are here to help you enjoy your trading and to help you gradually get better at it. With decades of experience between them in total, you can rest assured that you will be provided with only high-quality information. With their help, your binary options strategy will be rock-solid.
Trend, support and resistance lines Let's Begin with Trends : Your Best friend. As we already know, technical analysis studies price charts in order to forecast future direction of prices. How does it work and what can this chart tell us? Let’s clarify this.
Let’s start with the first axiom of technical analysis – price moves in trends. The axiom meaning can be explained by the fact that price movements always have direction and continuing nature. The price may seem to move chaotically upward or downward in the chart. However, price movements have its direction, which is called trend.
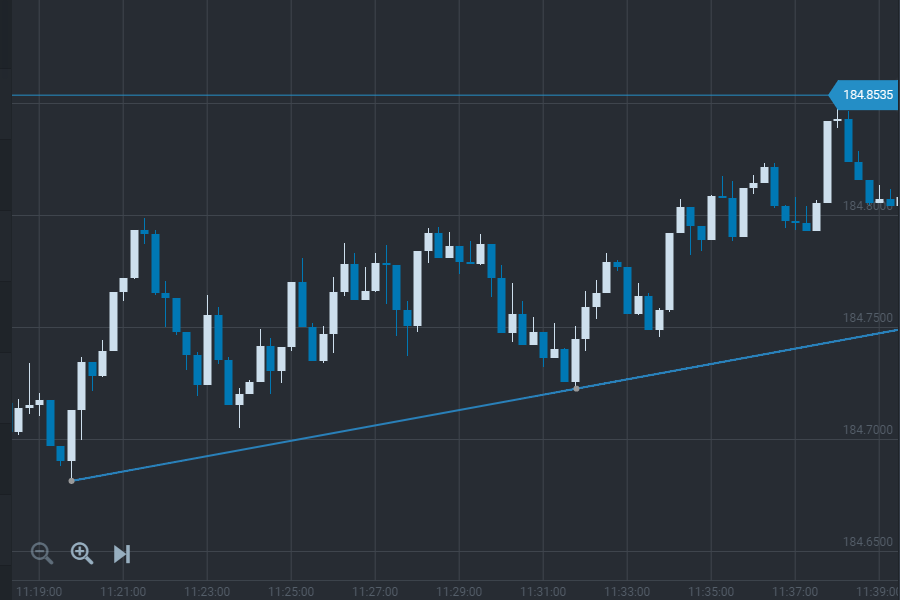
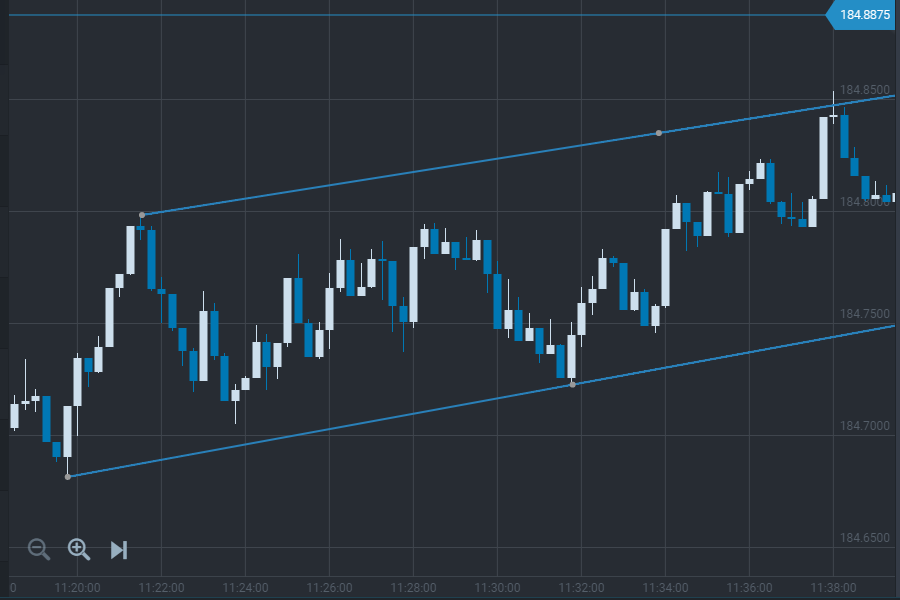
Trend is a directional price movement with certain duration. Looking at the picture above we can notice that despite price moves upward and downward the general direction of all movements is upward. Now let’s get a clear view of the types of trends. They fall into three types depending on direction and duration:
1. Duration:
a. Short-term trend lasts from several minutes to 2 weeks.
b. Intermediate trend may last from 2 weeks to half a year (6 months).
c. Long-term trend is a long-lasting price movement in one direction within several months or even years (from 6 months).
2. Direction:
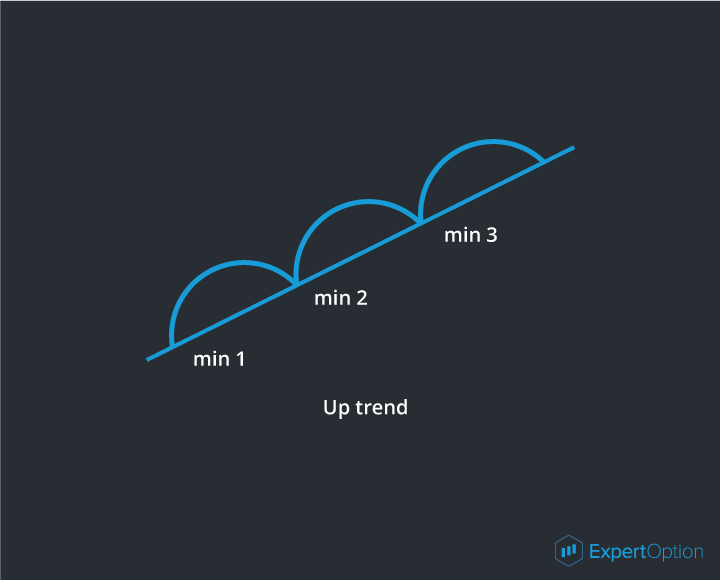
a. Uptrend (bullish trend) is a price movement in which each next minimum is higher than previous one. Up trend
A trend line can be defined as a line, which connects the minimums of uptrend.
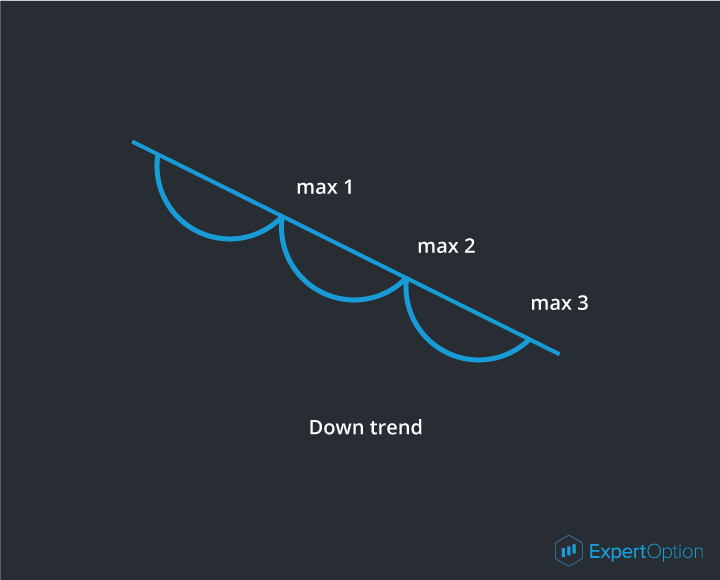
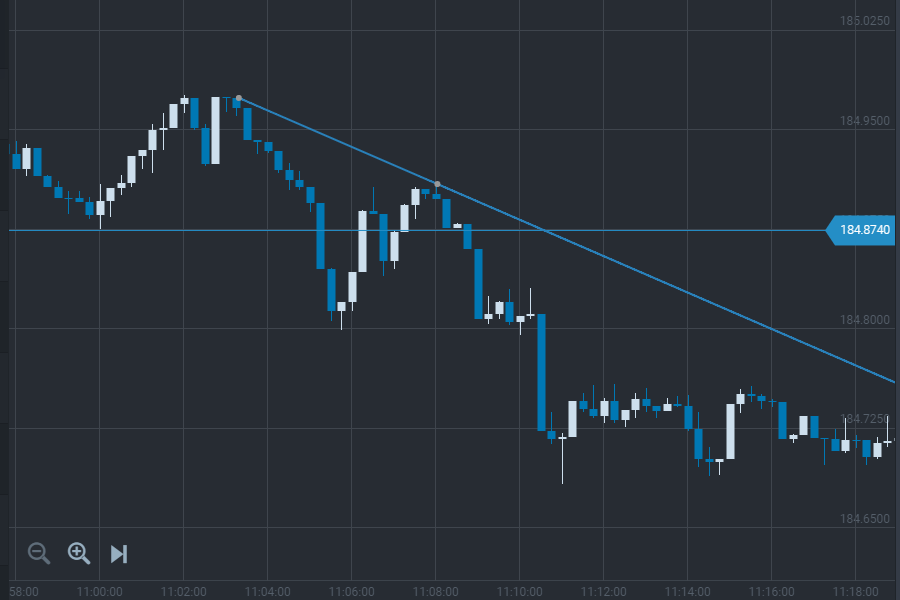
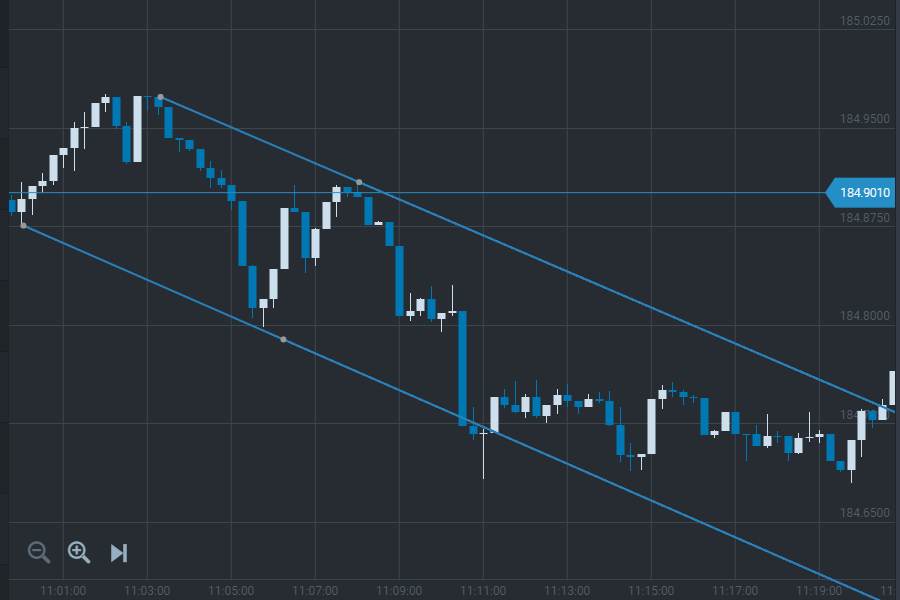
b. Downtrend (bear trend) is a price movement in which each next maximum is lower than previous one. Downtrend
A down trend line can be defined as a line, which connects the maximums of trend.
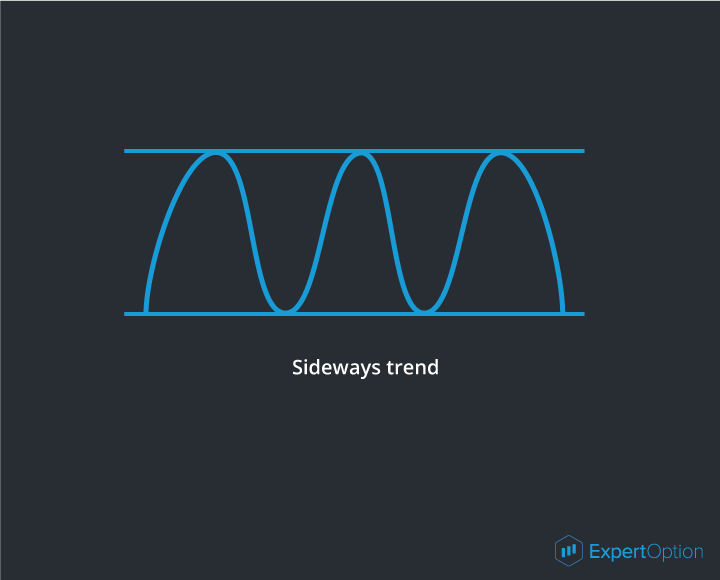
c. Sideways trend (flat) describes price movements without clear direction. Sideways trend
Binary option trading is generally based on trends with the shortest duration or short-term trends. Therefore, there is no sense in searching for the trends lasting more than 30 minutes for short-term instruments in the form of binary options. It is due to the fact, that trading within one hour time frame is based on short tendencies which are not influenced by other continuing trends of longer time frames. It would be enough if you could define current tendency within 30 minute time frame and use it.
Thus, as you might have already known, a trend line is a line defining the direction of a trend. You will need two points to build a trend line – the closest minimums of ascendant tendency and the closest maximums of descendant tendency. In order to see the borders of a tendency to a trend line we need to build another line parallel to the trend line, which is called a channel line. The channel line is built using one or two maximum points in an uptrend or using minimum points in a downtrend. That is the way a trend channel is formed. You can see in the pictures that the channel lines cross the critical points of the tendency. The channel line in an uptrend is drawn along the candle shadows of the maximums and, conversely, in a downtrend, the channel line is drawn along the candle shadows of the tendency minimums. To make sure the line is drawn correctly it should be based at least on two points.
The main rule of trading in the trend channel is to buy in an uptrend and sell in the downtrend. Thus, we can see that the trend channel is essential to trade within the bounds of the existing tendency, which is limited by it.
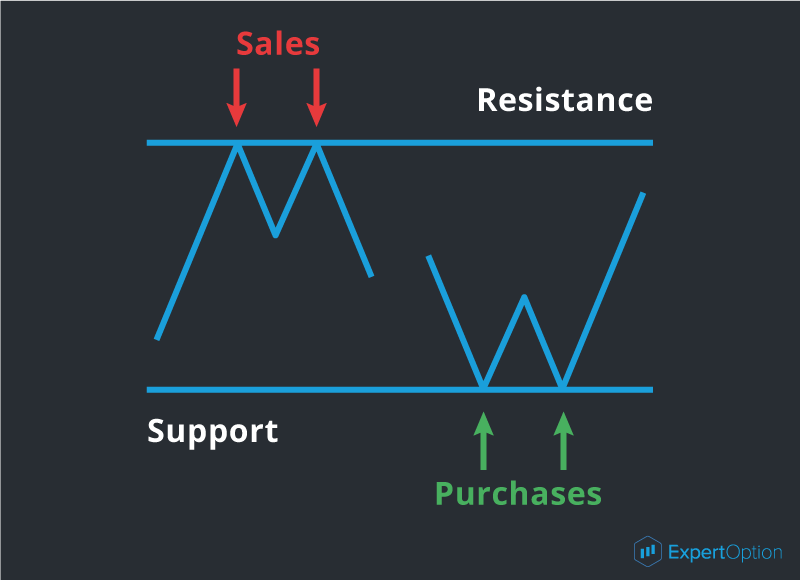
There are also strength levels besides trend lines. A strength level is a price level in which a price movement stops or changes its direction. There two types of strength levels:
1. Resistance trend line – is a price level, which is prevented from increasing by the market participants. Simply put, if this level is reached, than everybody starts selling.
2. Support trend line – is the price level, which is prevented from decreasing by the market participants. Similarly, if this level is reached, than everybody starts buying. Sales, Purchases
The following levels can be strength levels:
• Trend and channel lines;
• Historical level – maximum or minimum price values reached throughout the history of trading. That is to say, market remembers these levels for a long time and will immediately respond if the price reaches these levels.
• Psychological level – this level results from round price values. For example 16 000 or 16 500. As a rule this phenomena is caused by human psychology, as it is always easier to operate with round price values.
All those levels can represent resistance or support depending on whether the price is higher or lower than this level at the current moment.
Thus, we have learnt that the price movement always has its direction, which is possible to define and limit by the trend and channel lines. The duration of this movement can vary from several minutes to several months. There are also strength levels which can limit movement as well and market participants tend to make decisions basing on them. Later we are going to learn how we can use this knowledge from a practical point of view.
To trade in the forex market successfully you should forecast price behavior on the chart. One of the instruments for this kind of job is technical analysis. Technical analysis is a method of price movement forecasting on the base of price movement history. Studying movement history where the price will go in future. As you may have guessed the main object of technical analysis is a currency rates history or price movement chart. The price movement chart is built on axes where the vertical axis shows a price and the horizontal axis shows time.
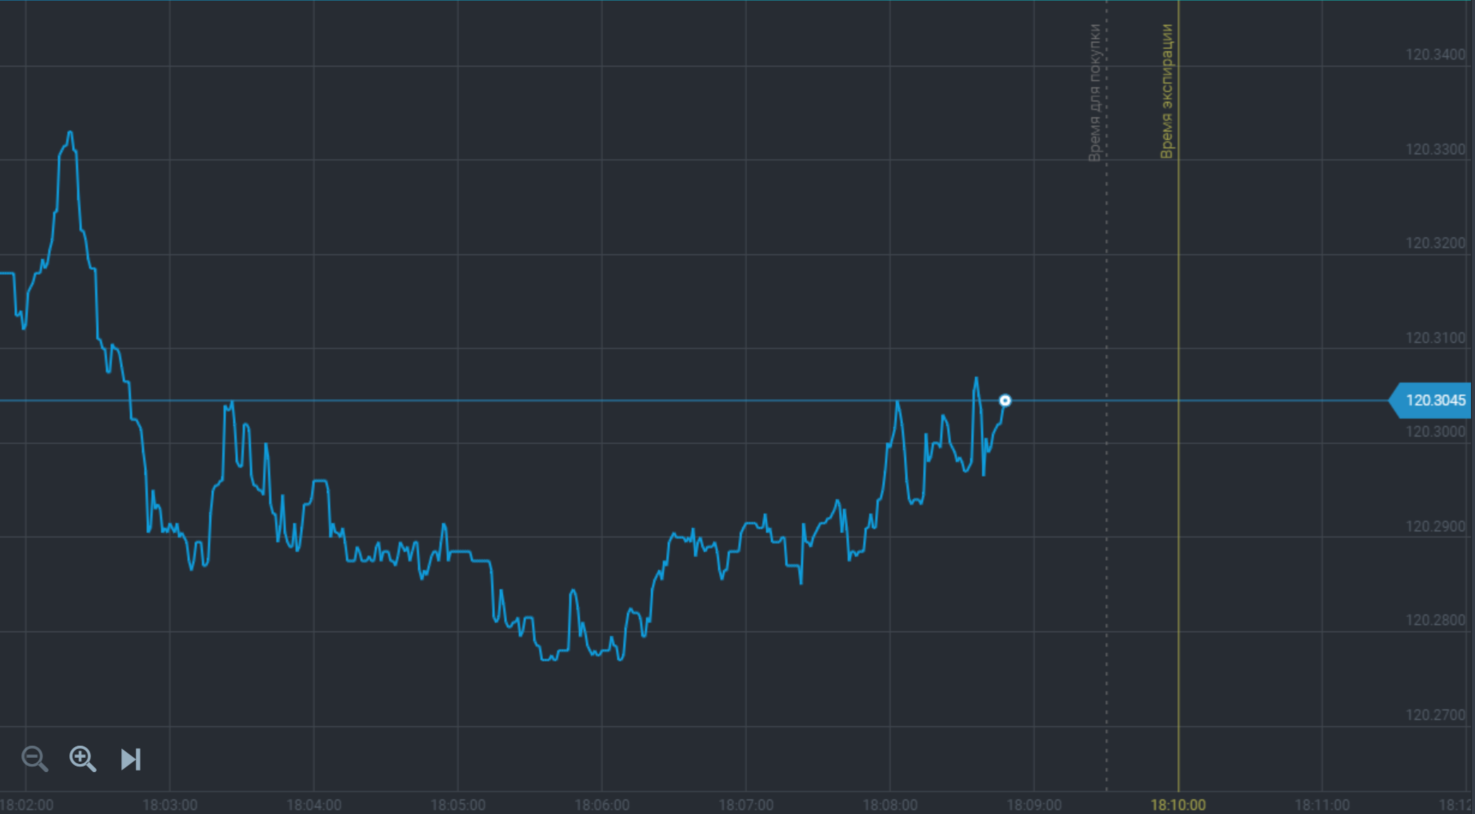
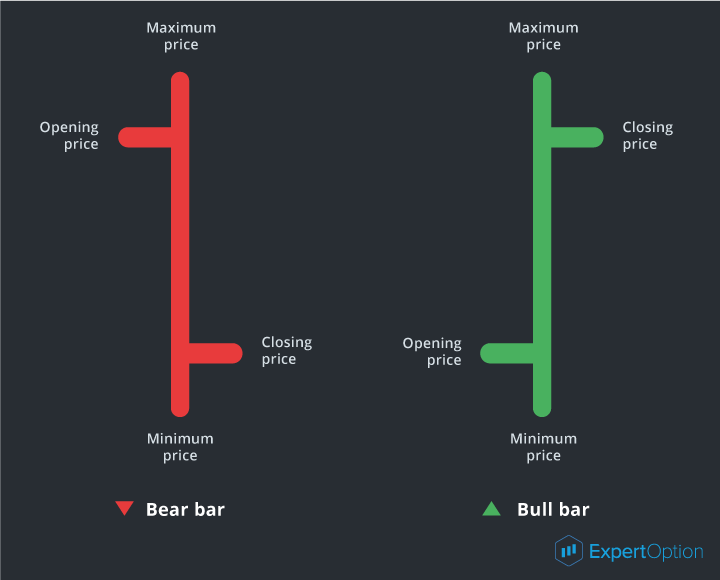
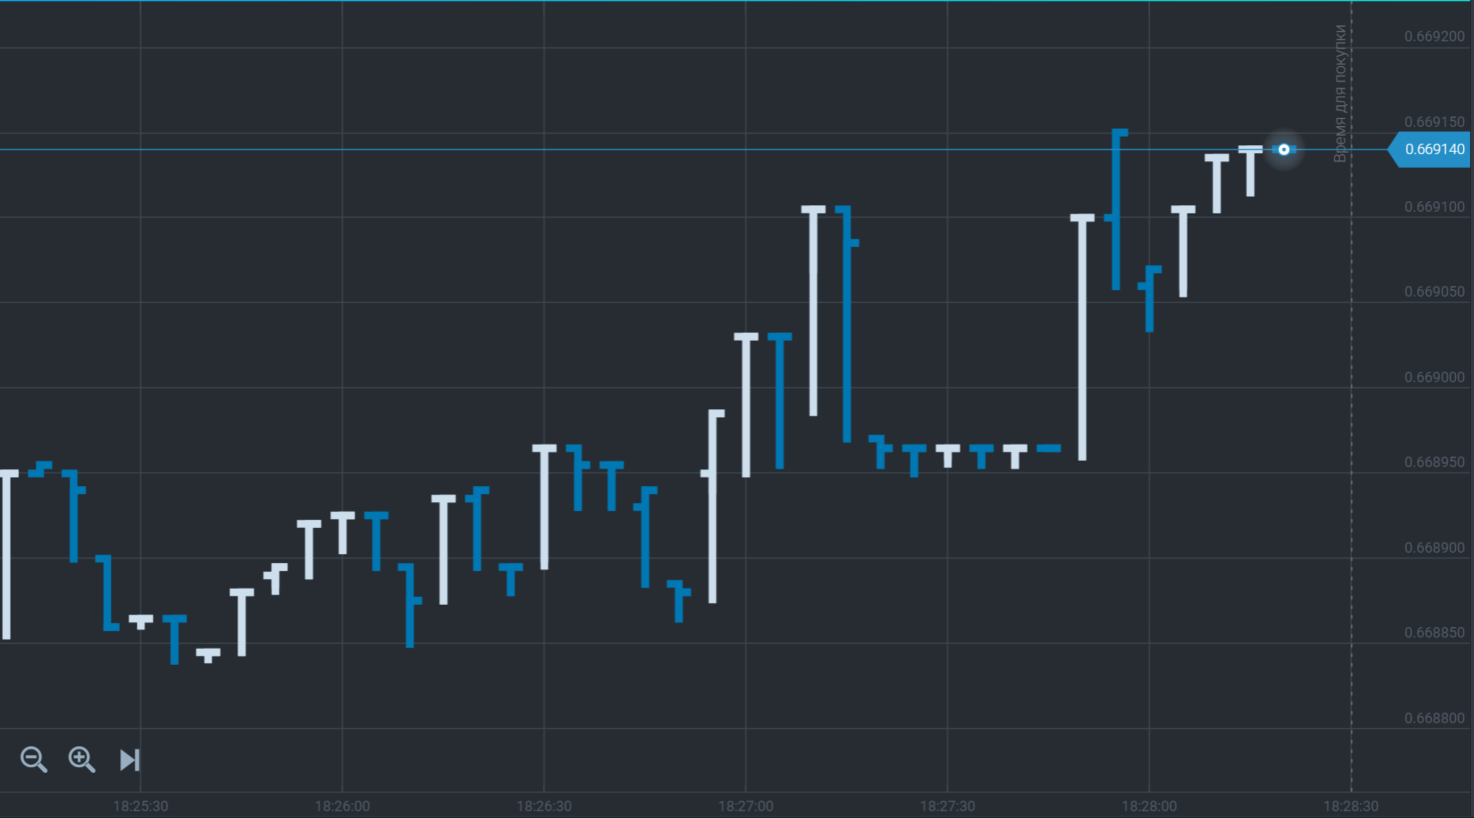
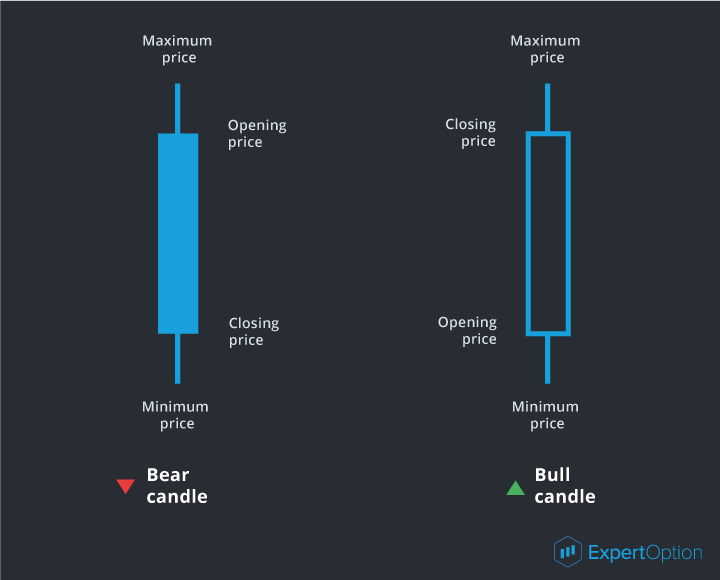
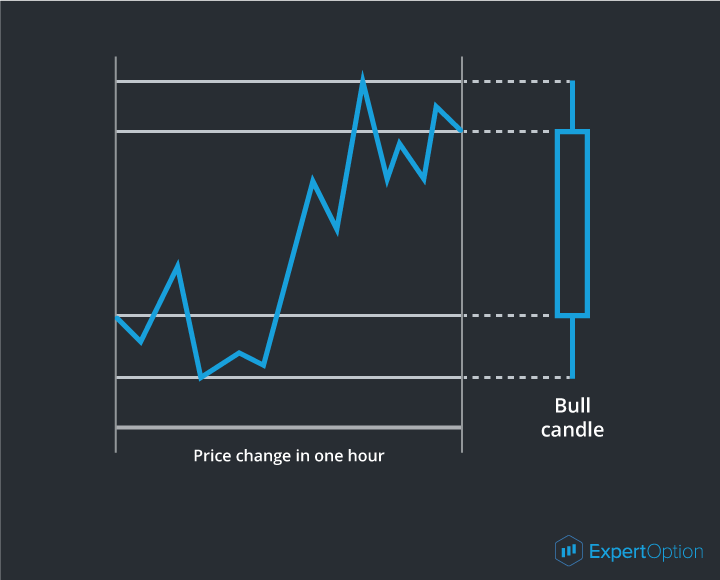
There are some price types where you can find some repeating patterns. If you have studied and remembered them you will be able to forecast charts based on building method and time intervals. At first let us review the difference of charts based on building method. The simplest one is a line chart which displays price changes in single prices connected with a line. These prices are fixed on the chart when time interval ends and each new price is connected by a line with a previous price. It looks as follows: The following type is a bar chart. This chart is made of bars which show the price at the beginning of time interval (opening price), maximum and minimum prices within this period and the price at the end of time interval (closing price). Here is the example of price bars: The bar chart looks as follows: The third chart is a candlesticks chart. A candlesticks chart shows the same price information as a bar chart, but in prettier and easier format. All that because it is made of rectangles called as candlestick bars. Here is the example of candlestick bars: Where a bear candle indicates the price falls, and a bull candle shows the price raises. A candlesticks chart will look as follows: So as we see, there are three types of charts: line, bar and candlesticks charts. Also the charts are recognized according to time period: 1 minute, 5 minutes, 15 minutes, 30 minutes, 1 hour, 4 hours, a day, a week and a month. Time period is the time interval when price was fixed on the chart. For example, if time interval is 1 hour, on the chart we will see a bar or candle indicating price at the beginning of an hour, maximum and minimum prices within this hour and price at the end of an hour. Here is the example: Changing intervals of the charts you can do analysis of price history on every time intervals.
Technical Analysis is what you need
So, what the technical analysis is? The technical analysis uses charts to study the price history and find patterns. To use the price movement history for analysis we need to know three rules (axioms) of technical analysis:
1) Price moves forward – price change is always forward, whether price raises or drops, and it has its period. This axiom is a basis of tendency (trend) analysis and has the following conclusions: a current direction of price movement in the market most probably will continue rather than stop; and price will be moving in one direction until it becomes flat.
2) History repeats – if the price level was reached before it can be reached again in future. The same goes to price behavior graphical models which can appear in future with the same results as in the past. Studying the history of these price movement patterns gives us an opportunity more likely to foresee the further movement direction;
3) Price considers everything – any event affecting on currency price (political, economic and natural) is included into the price and it raises or drops depending on positive or negative affect of this event.
So thanks to basic rules of the technical analysis we can more likely forecast the price movement, determine its direction and period of this direction. It is necessary to understand that the market does not always follow the patterns found in the price movement history. Such unusual situations may happen, but with each new experience the trader will be able to find more predictable situations and make more precise estimation. For this very reason you should understand that if you have less experience you will use the most visible and prominent price movement patterns better to receive a maximum result. Technical analysis is not a science but it is more likely an art. And if a beginning trader is more attentive and hardworking he has more chances to receive a desired result.
Please refer to Section to learn more about Technical Analysis
A binary option, or asset-or-nothing option, is type of option in which the payoff is structured to be either a fixed amount of compensation if the option expires in the money, or nothing at all if the option expires out of the money. The success of a binary option is thus based on a yes or no proposition, hence “binary”. A binary option automatically exercises, meaning the option holder does not have the choice to buy or sell the underlying asset.
BREAKING DOWN 'Binary Option'
Investors may find binary options attractive because of their apparent simplicity, especially since the investor must essentially only guess whether something specific will or will not happen. For example, a binary option may be as simple as whether the share price of ABC Company will be above $25 on November 22nd at 10:45 am. If ABC’s share price is $27 at the appointed time, the option automatically exercises and the option holder gets a preset amount of cash. What is a 'Binary Option' A binary option, or asset-or-nothing option, is type of option in which the payoff is structured to be either a fixed amount of compensation if the option expires in the money, or nothing at all if the option expires out of the money. The success of a binary option is thus based on a yes or no proposition, hence “binary”. A binary option automatically exercises, meaning the option holder does not have the choice to buy or sell the underlying asset.
BREAKING DOWN 'Binary Option' Investors may find binary options attractive because of their apparent simplicity, especially since the investor must essentially only guess whether something specific will or will not happen. For example, a binary option may be as simple as whether the share price of ABC Company will be above $25 on November 22nd at 10:45 am. If ABC’s share price is $27 at the appointed time, the option automatically exercises and the option holder gets a preset amount of cash. Difference Between Binary and Plain Vanilla Options Binary options are significantly different from vanilla options. Plain vanilla options are a normal type of option that does not include any special features. A plain vanilla option gives the holder the right to buy or sell an underlying asset at a specified price on the expiration date, which is also known as a plain vanilla European option. While a binary option has special features and conditions, as stated previously.
Binary options are occasionally traded on platforms regulated by the Securities and Exchange Commission (SEC) and other regulatory agencies, but are most likely traded over the Internet on platforms existing outside of regulations. Because these platforms operate outside of regulations, investors are at greater risk of fraud. Conversely, vanilla options are typically regulated and traded on major exchanges.
For example, a binary options trading platform may require the investor to deposit a sum of money to purchase the option. If the option expires out-of-the-money, meaning the investor chose the wrong proposition, the trading platform may take the entire sum of deposited money with no refund provided.
Binary Option Real World Example Assume the futures contracts on the Standard & Poor's 500 Index (S&P 500) is trading at 2,050.50. An investor is bullish and feels that the economic data being released at 8:30 am will push the futures contracts above 2,060 by the close of the current trading day. The binary call options on the S&P 500 Index futures contracts stipulate that the investor would receive $100 if the futures close above 2,060, but nothing if it closes below. The investor purchases one binary call option for $50. Therefore, if the futures close above 2,060, the investor would have a profit of $50, or $100 - $50
Difference Between Binary and Plain Vanilla Options
Binary options are significantly different from vanilla options. Plain vanilla options are a normal type of option that does not include any special features. A plain vanilla option gives the holder the right to buy or sell an underlying asset at a specified price on the expiration date, which is also known as a plain vanilla European option. While a binary option has special features and conditions, as stated previously.
Binary options are occasionally traded on platforms regulated by the Securities and Exchange Commission (SEC) and other regulatory agencies, but are most likely traded over the Internet on platforms existing outside of regulations. Because these platforms operate outside of regulations, investors are at greater risk of fraud. Conversely, vanilla options are typically regulated and traded on major exchanges.
For example, a binary options trading platform may require the investor to deposit a sum of money to purchase the option. If the option expires out-of-the-money, meaning the investor chose the wrong proposition, the trading platform may take the entire sum of deposited money with no refund provided.
Binary Option Real World Example
Assume the futures contracts on the Standard & Poor's 500 Index (S&P 500) is trading at 2,050.50. An investor is bullish and feels that the economic data being released at 8:30 am will push the futures contracts above 2,060 by the close of the current trading day. The binary call options on the S&P 500 Index futures contracts stipulate that the investor would receive $100 if the futures close above 2,060, but nothing if it closes below. The investor purchases one binary call option for $50. Therefore, if the futures close above 2,060, the investor would have a profit of $50, or $100 - $50