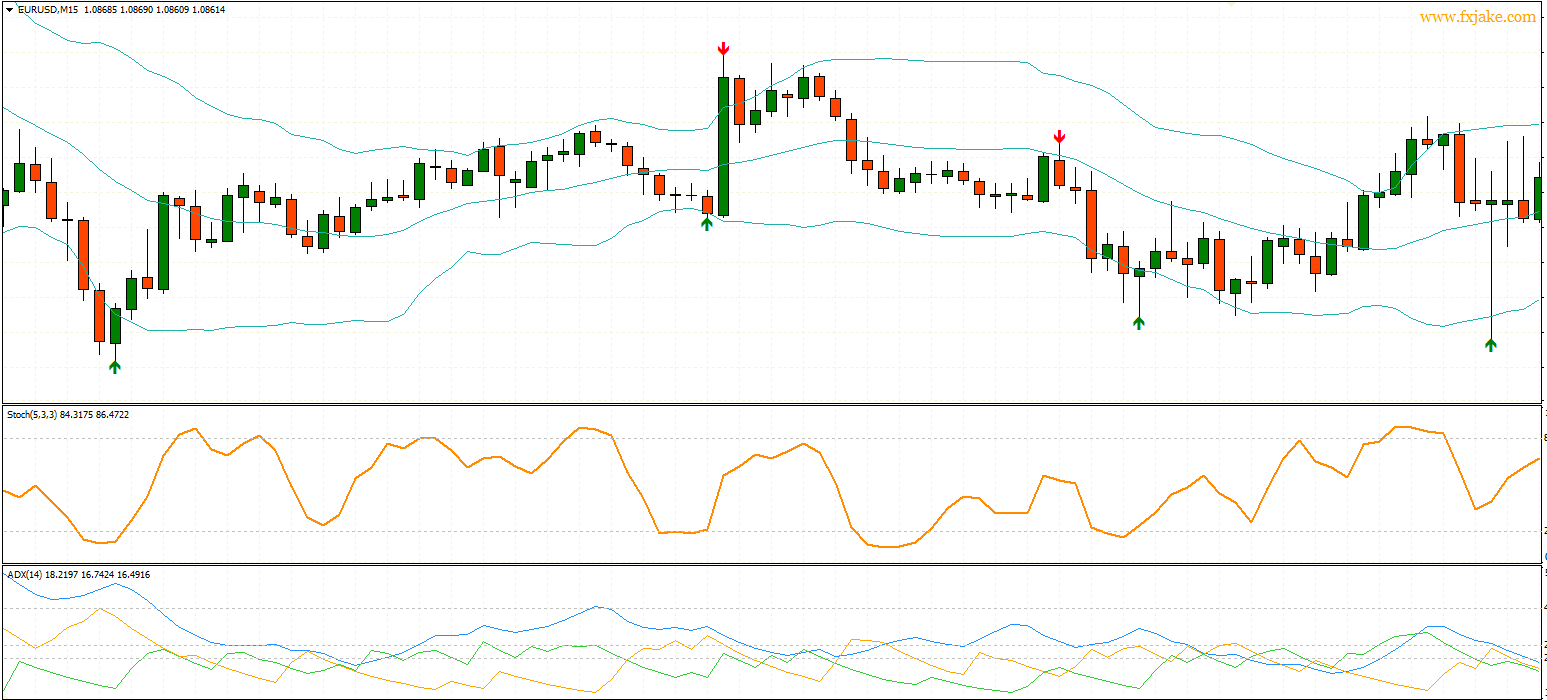
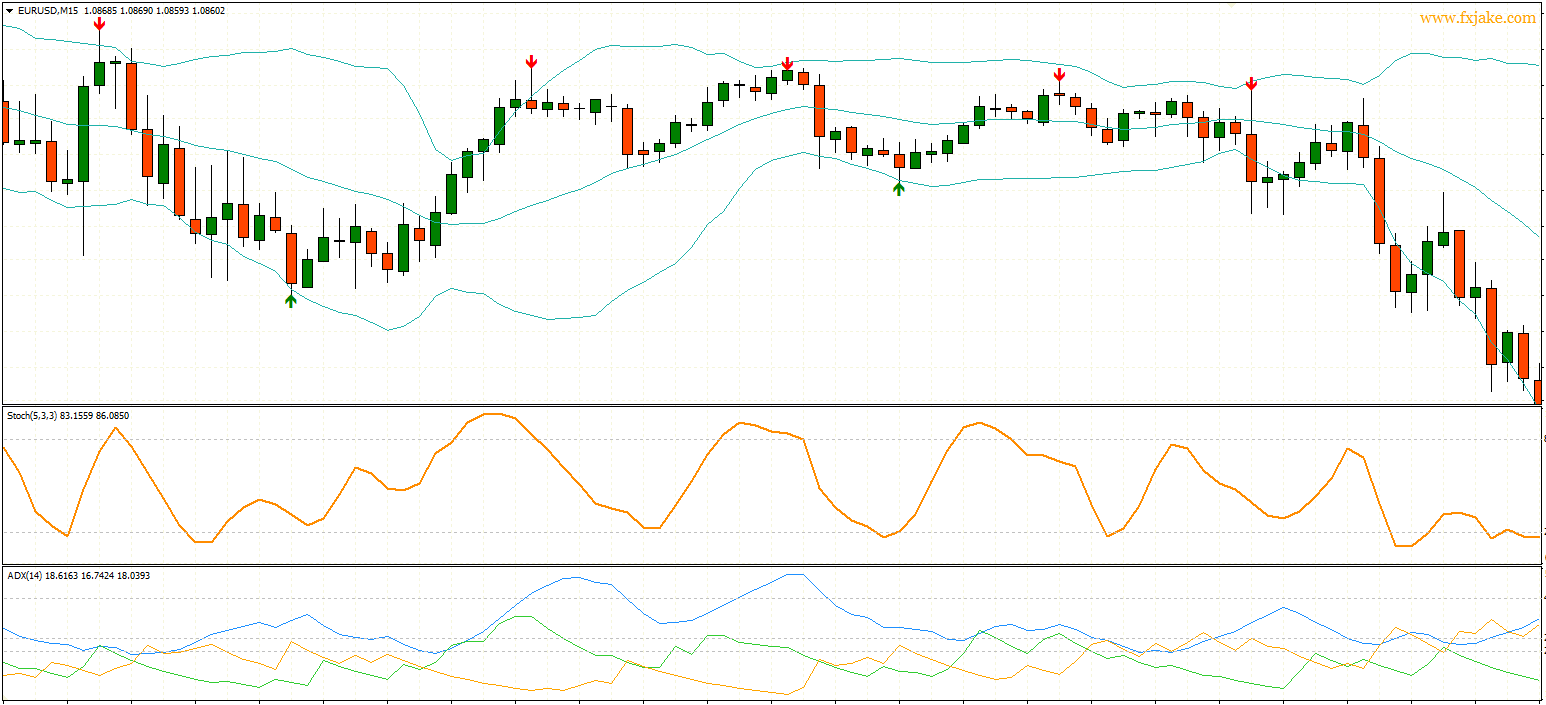
Triple X strategy combines three of the most popular indicators (Bollinger Bands, Stochastic Oscillator and ADX). It quickly evaluates how good an idea it is to enter a trade.


How to setup the chart
Timeframe: M15 Template: TripleX-strategy (eDisc download, ulozto download)How does this strategy work
As you already know, this strategy uses 3 strong and proven indicators. Using Bollinger bands we will see when the price diverges from average. If it gets above or under the outer Bollinger lines, we can follow other indicators. Stochastic indicator shows us if price is in an overbought or in anoversold area. That helps us decide the next price movements. And most importantly: ADX shows us how strong the trend is. And how to connect these indicators into one strong strategy for binary trade? Keep on reading…When to enter the trade
Buying a CALL option:- The previous candle is falling (bearish) and is under the lower Bollinger band (ideally, there is an arrow below)
- The current candle rises back above this line
- Stochastic indicator is at around around 20 (and rising)
- ADX indicator rises above the level 25
- WE BUY A CALL OPTION WITH 30 OR 60 MINUTE EXPIRATION TIME
- The revious candle is rising (bullish) and is above the upper Bollinger band (ideally, it has an arrow above)
- The current candle falls back below this curve
- Stochastic indicates around 80 (it’s better if it’s falling)
- ADX indicator rises above 25 again
- WE BUY A PUT OPTION WITH 30 OR 60 MINUTE EXPIRATION TIME
What does this strategy look like

0 comments:
Post a Comment