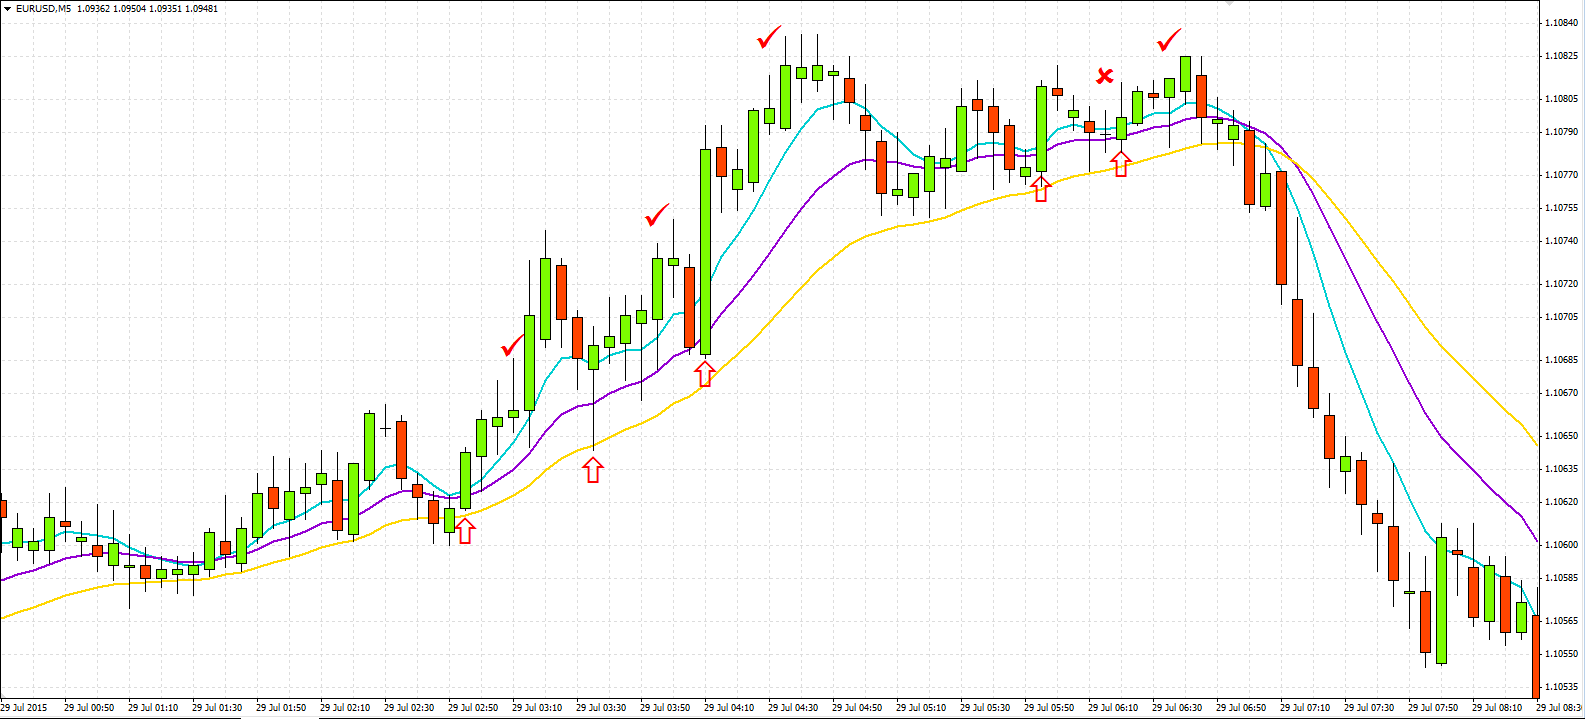
Blue moving average is on top and golden is on the bottom.This strategy uses only one indicator and that is good old Moving Average which you may have already used and know about it. We will use three EMA (Exponential Moving Average) set to 6, 14 and 26 colored differently to determine the trend and find opportunities to open high/low trades. We are using M5 timeframe and place trades with 15 minute expiration times.
How to setup the chart
Timeframe: M5
Template: EMA Rainbow Strategy (Download from here)
How this strategy works


When to open trades
Buying CALL option:
- Blue indicator moving average is on top and golden is on the bottom.
- Price moves to violet moving average from the top and crosses it. If one of two other candles rises and crosses above violet moving average again, we buy 15 minute CALL.
Buying PUT option:
- Golden moving average is on top and blue is on the bottom.
- Price moves to violet moving average from the bottom and crosses it. If one of two other candles declines and crosses below violet moving average, we buy 15 minute PUT.
How does this strategy look like
Try this strategy on a demo account
This strategy can be easily tested on demo account. Open demo account for binary option trading here (binary option demo account) and you can start trading on a demo account immediately. For example, broker topoption offers demo account only after initial deposit
Strategy video
This guy on a video below shows how to use this strategy, so enjoy.
On the video below, made by the broker IQ Option the same strategy is used.
[…] EMA Rainbow Strategy for... […]
ReplyDelete