Trend, support and resistance lines
Let's Begin with Trends : Your Best friend.
As we already know, technical analysis studies price charts in order to forecast future direction of prices. How does it work and what can this chart tell us? Let’s clarify this.
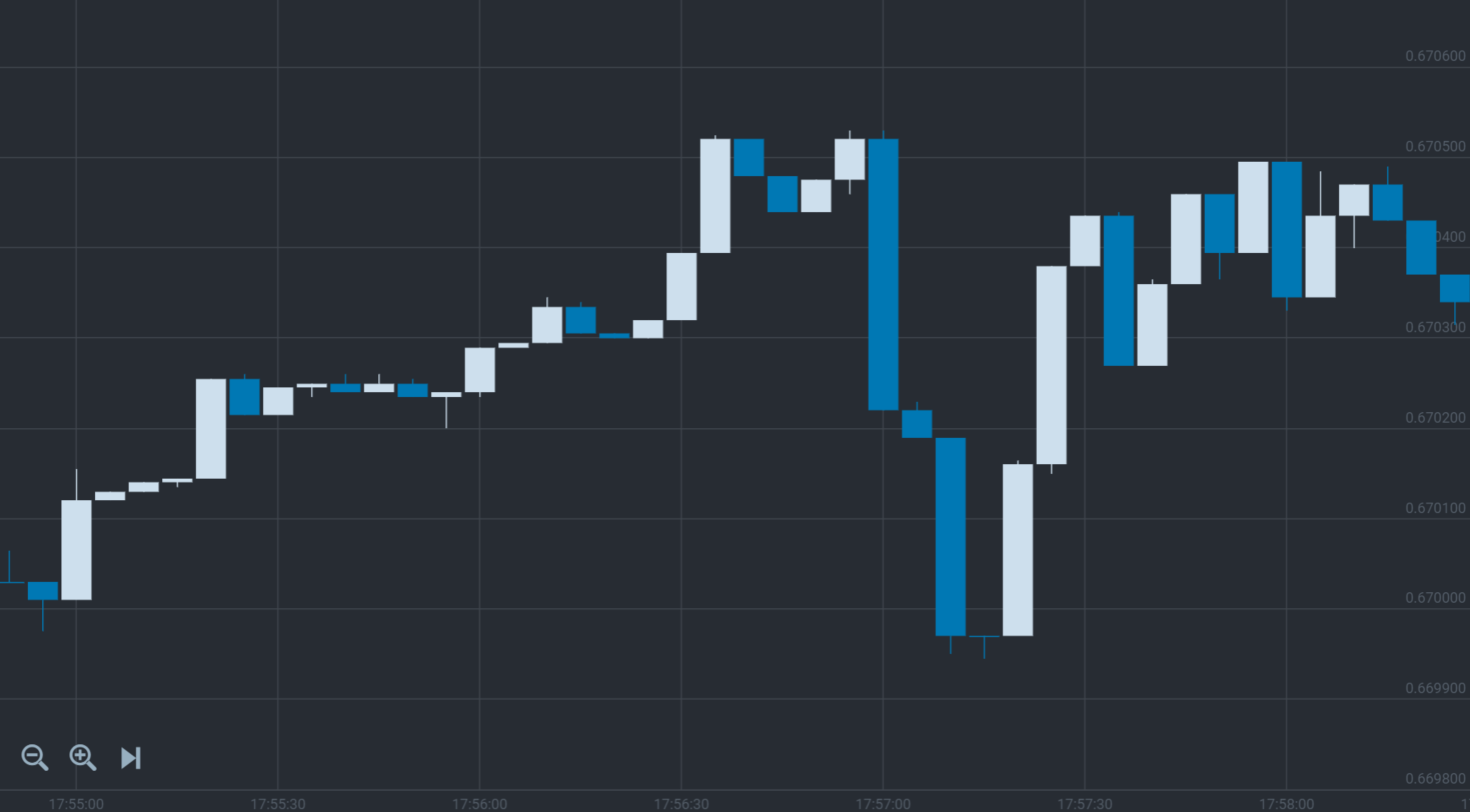
Let’s start with the first axiom of technical analysis – price moves in trends. The axiom meaning can be explained by the fact that price movements always have direction and continuing nature. The price may seem to move chaotically upward or downward in the chart. However, price movements have its direction, which is called trend.
Trend is a directional price movement with certain duration.
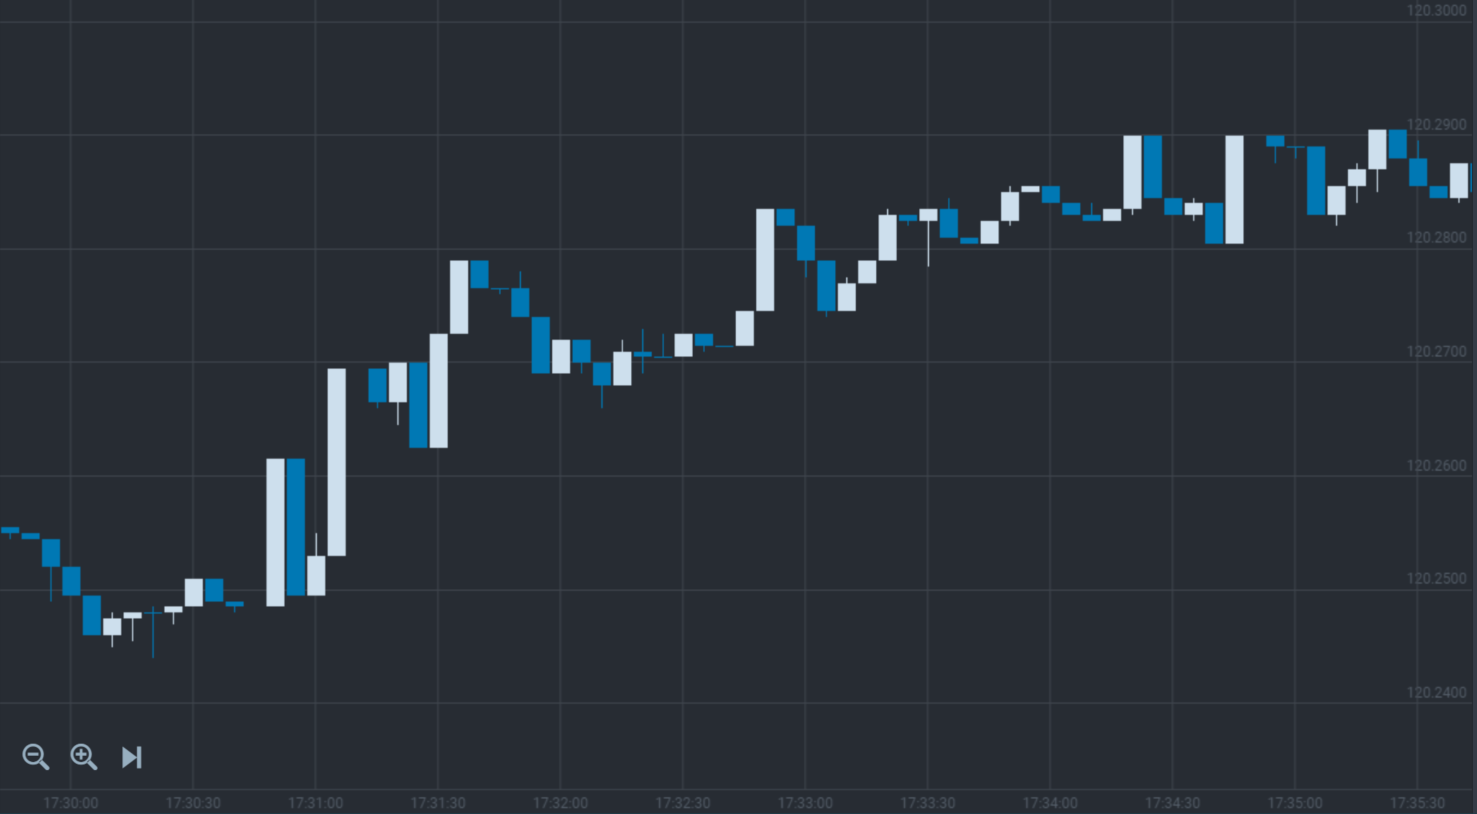
Looking at the picture above we can notice that despite price moves upward and downward the general direction of all movements is upward. Now let’s get a clear view of the types of trends. They fall into three types depending on direction and duration:
1. Duration:
a. Short-term trend lasts from several minutes to 2 weeks.
b. Intermediate trend may last from 2 weeks to half a year (6 months).
c. Long-term trend is a long-lasting price movement in one direction within several months or even years (from 6 months).
2. Direction:
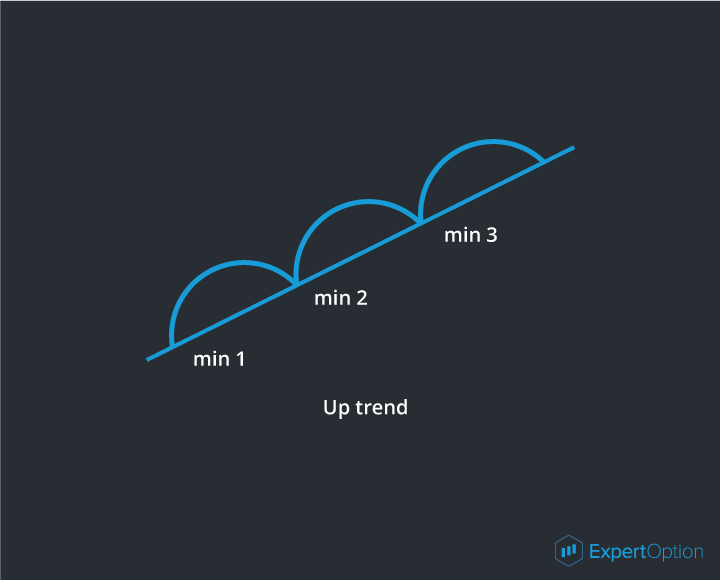
a. Uptrend (bullish trend) is a price movement in which each next minimum is higher than previous one.
Up trend
A trend line can be defined as a line, which connects the minimums of uptrend.
b. Downtrend (bear trend) is a price movement in which each next maximum is lower than previous one.
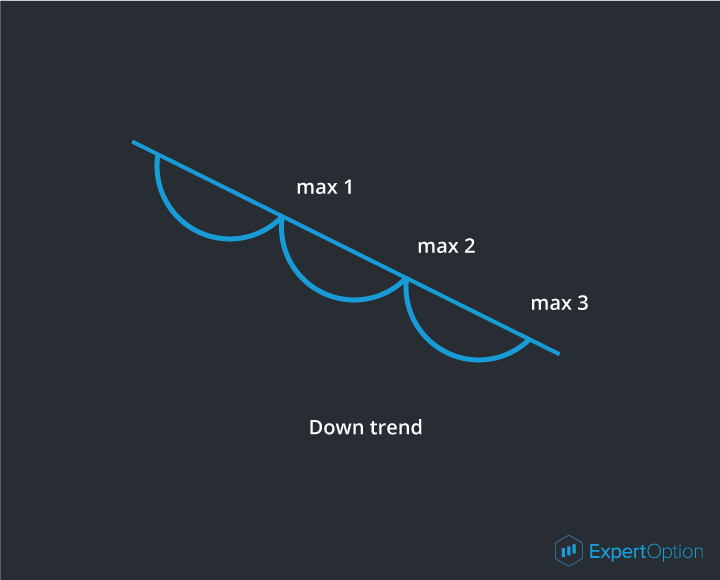
Downtrend
A down trend line can be defined as a line, which connects the maximums of trend.
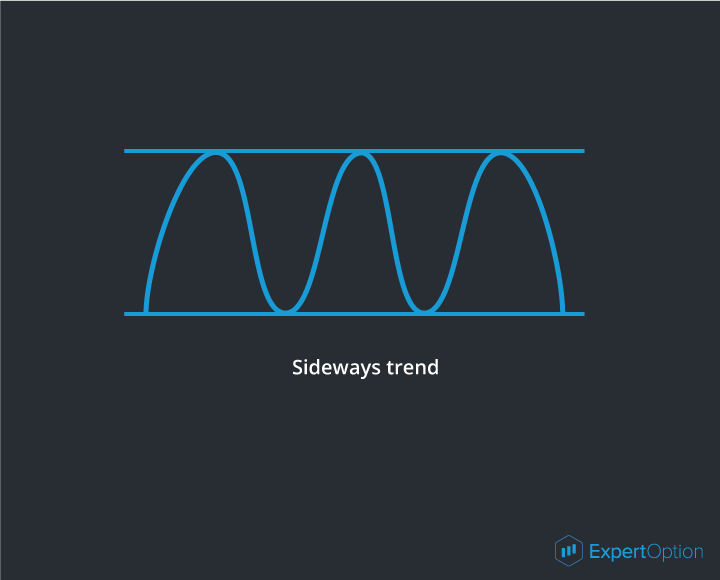
c. Sideways trend (flat) describes price movements without clear direction.
Sideways trend
Binary option trading is generally based on trends with the shortest duration or short-term trends. Therefore, there is no sense in searching for the trends lasting more than 30 minutes for short-term instruments in the form of binary options. It is due to the fact, that trading within one hour time frame is based on short tendencies which are not influenced by other continuing trends of longer time frames. It would be enough if you could define current tendency within 30 minute time frame and use it.
Thus, as you might have already known, a trend line is a line defining the direction of a trend. You will need two points to build a trend line – the closest minimums of ascendant tendency and the closest maximums of descendant tendency.
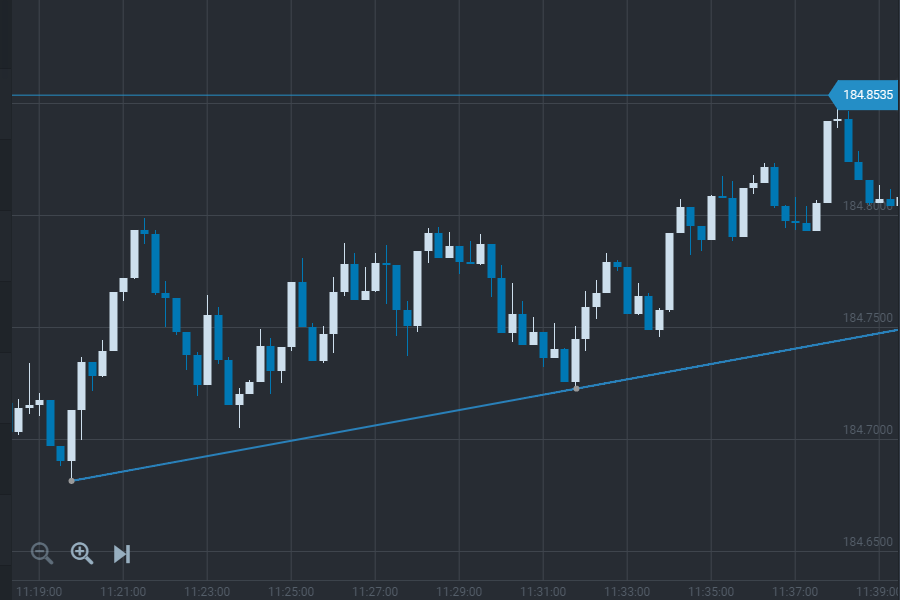
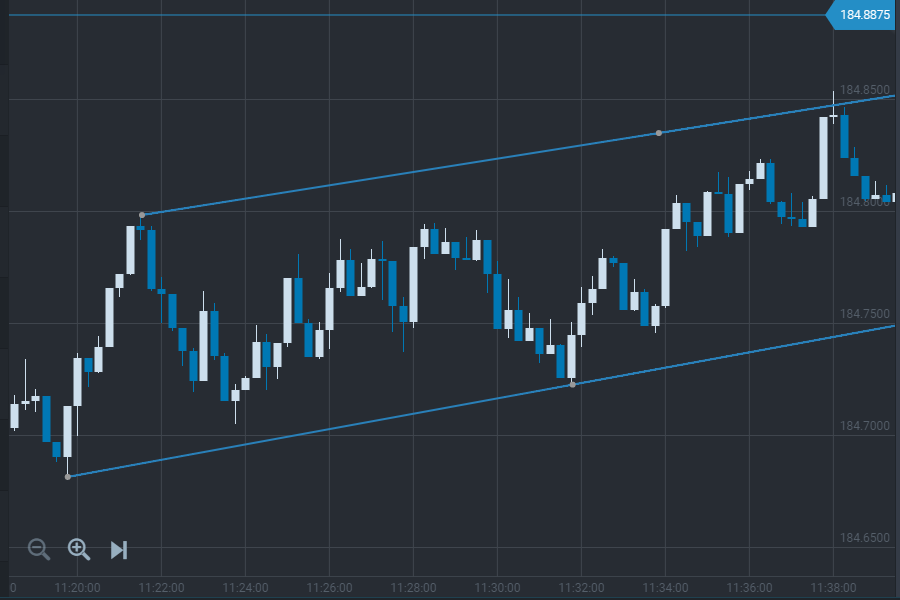
In order to see the borders of a tendency to a trend line we need to build another line parallel to the trend line, which is called a channel line. The channel line is built using one or two maximum points in an uptrend or using minimum points in a downtrend. That is the way a trend channel is formed.
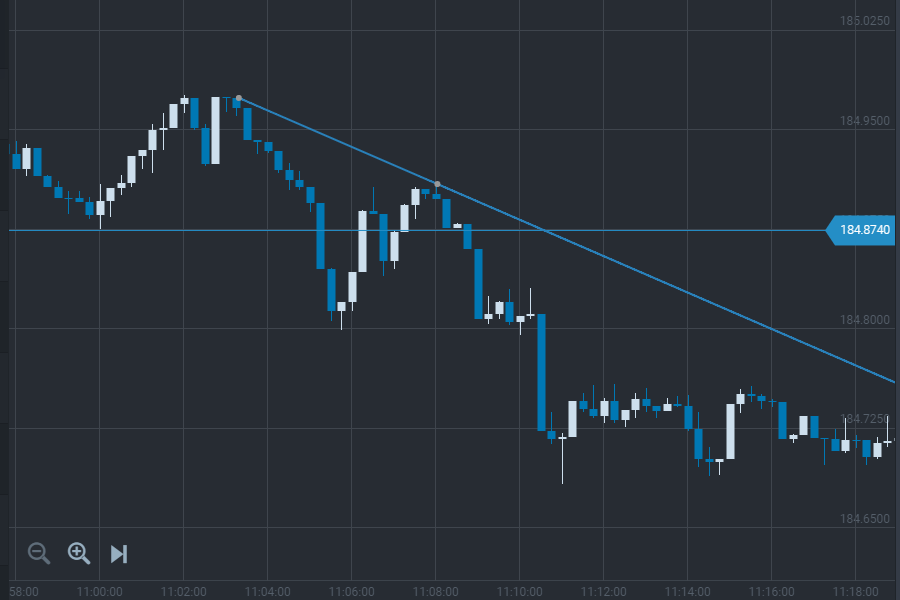
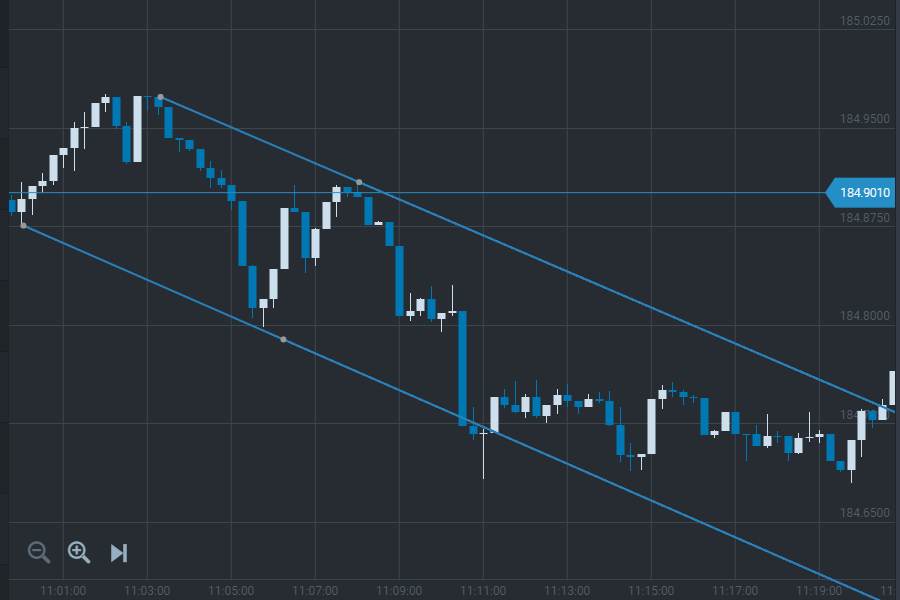
You can see in the pictures that the channel lines cross the critical points of the tendency. The channel line in an uptrend is drawn along the candle shadows of the maximums and, conversely, in a downtrend, the channel line is drawn along the candle shadows of the tendency minimums. To make sure the line is drawn correctly it should be based at least on two points.
The main rule of trading in the trend channel is to buy in an uptrend and sell in the downtrend. Thus, we can see that the trend channel is essential to trade within the bounds of the existing tendency, which is limited by it.
There are also strength levels besides trend lines. A strength level is a price level in which a price movement stops or changes its direction. There two types of strength levels:
1. Resistance trend line – is a price level, which is prevented from increasing by the market participants. Simply put, if this level is reached, than everybody starts selling.
2. Support trend line – is the price level, which is prevented from decreasing by the market participants. Similarly, if this level is reached, than everybody starts buying.
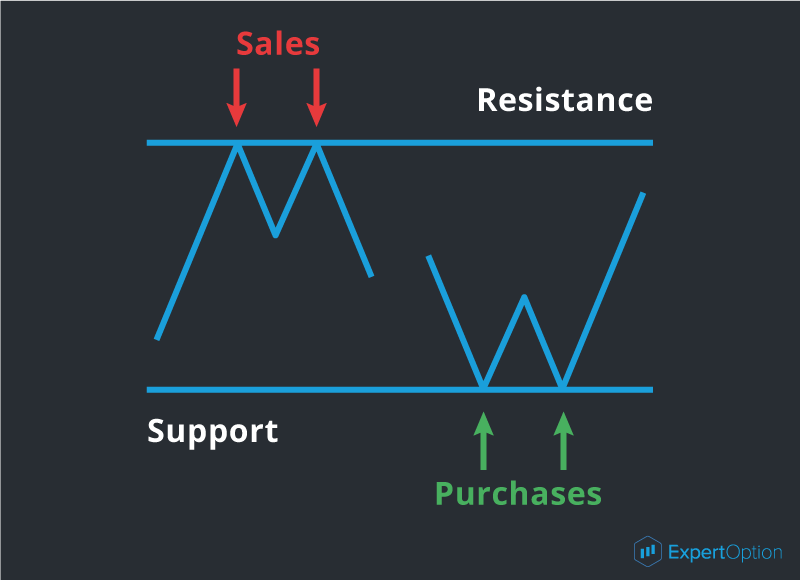
Sales, Purchases
The following levels can be strength levels:
• Trend and channel lines;
• Historical level – maximum or minimum price values reached throughout the history of trading. That is to say, market remembers these levels for a long time and will immediately respond if the price reaches these levels.
• Psychological level – this level results from round price values. For example 16 000 or 16 500. As a rule this phenomena is caused by human psychology, as it is always easier to operate with round price values.
All those levels can represent resistance or support depending on whether the price is higher or lower than this level at the current moment.
Thus, we have learnt that the price movement always has its direction, which is possible to define and limit by the trend and channel lines. The duration of this movement can vary from several minutes to several months. There are also strength levels which can limit movement as well and market participants tend to make decisions basing on them. Later we are going to learn how we can use this knowledge from a practical point of view.
Let's Begin with Trends : Your Best friend.
As we already know, technical analysis studies price charts in order to forecast future direction of prices. How does it work and what can this chart tell us? Let’s clarify this.
Let’s start with the first axiom of technical analysis – price moves in trends. The axiom meaning can be explained by the fact that price movements always have direction and continuing nature. The price may seem to move chaotically upward or downward in the chart. However, price movements have its direction, which is called trend.
Trend is a directional price movement with certain duration.
Looking at the picture above we can notice that despite price moves upward and downward the general direction of all movements is upward. Now let’s get a clear view of the types of trends. They fall into three types depending on direction and duration:
1. Duration:
a. Short-term trend lasts from several minutes to 2 weeks.
b. Intermediate trend may last from 2 weeks to half a year (6 months).
c. Long-term trend is a long-lasting price movement in one direction within several months or even years (from 6 months).
2. Direction:
a. Uptrend (bullish trend) is a price movement in which each next minimum is higher than previous one.
Up trend
A trend line can be defined as a line, which connects the minimums of uptrend.
b. Downtrend (bear trend) is a price movement in which each next maximum is lower than previous one.
Downtrend
A down trend line can be defined as a line, which connects the maximums of trend.
c. Sideways trend (flat) describes price movements without clear direction.
Sideways trend
Binary option trading is generally based on trends with the shortest duration or short-term trends. Therefore, there is no sense in searching for the trends lasting more than 30 minutes for short-term instruments in the form of binary options. It is due to the fact, that trading within one hour time frame is based on short tendencies which are not influenced by other continuing trends of longer time frames. It would be enough if you could define current tendency within 30 minute time frame and use it.
Thus, as you might have already known, a trend line is a line defining the direction of a trend. You will need two points to build a trend line – the closest minimums of ascendant tendency and the closest maximums of descendant tendency.
In order to see the borders of a tendency to a trend line we need to build another line parallel to the trend line, which is called a channel line. The channel line is built using one or two maximum points in an uptrend or using minimum points in a downtrend. That is the way a trend channel is formed.
You can see in the pictures that the channel lines cross the critical points of the tendency. The channel line in an uptrend is drawn along the candle shadows of the maximums and, conversely, in a downtrend, the channel line is drawn along the candle shadows of the tendency minimums. To make sure the line is drawn correctly it should be based at least on two points.
The main rule of trading in the trend channel is to buy in an uptrend and sell in the downtrend. Thus, we can see that the trend channel is essential to trade within the bounds of the existing tendency, which is limited by it.
There are also strength levels besides trend lines. A strength level is a price level in which a price movement stops or changes its direction. There two types of strength levels:
1. Resistance trend line – is a price level, which is prevented from increasing by the market participants. Simply put, if this level is reached, than everybody starts selling.
2. Support trend line – is the price level, which is prevented from decreasing by the market participants. Similarly, if this level is reached, than everybody starts buying.
Sales, Purchases
The following levels can be strength levels:
• Trend and channel lines;
• Historical level – maximum or minimum price values reached throughout the history of trading. That is to say, market remembers these levels for a long time and will immediately respond if the price reaches these levels.
• Psychological level – this level results from round price values. For example 16 000 or 16 500. As a rule this phenomena is caused by human psychology, as it is always easier to operate with round price values.
All those levels can represent resistance or support depending on whether the price is higher or lower than this level at the current moment.
Thus, we have learnt that the price movement always has its direction, which is possible to define and limit by the trend and channel lines. The duration of this movement can vary from several minutes to several months. There are also strength levels which can limit movement as well and market participants tend to make decisions basing on them. Later we are going to learn how we can use this knowledge from a practical point of view.