- The Demo Account Trick
- The EUR/USD Trick
- The Indicators Trick
Friday, 28 July 2017
HGI v2 5 Minute Binary Options Strategy
12:43 / by Unknown / in 5min strategy, BINARYOPTIONS, PATTERNS, Strategy / with 3 comments /
This is a binary options strategy that we’ve received. It’s very simple to use. You might be able to find this strategy on the web, but not this v2 version. It’s specifically upgraded to be simpler to use. We recommend only to trade in the direction of the current trend. If you use M1, go for 5 min expiration. if M5, 10 or 15 min expiration is better.
How to setup the chart
Timeframe: M1 or M5Template: HGI v2 (Download the strategy here: Ulozto.net or eDisk)
How does this trading strategy work?
As we said above, it’s good to be used with M1 or M5.- Trading on M1: Go for 5 min (300 sec) expiration times
- Trading on M5: Go for 10 min or 15 min expiration times
When to enter the trade
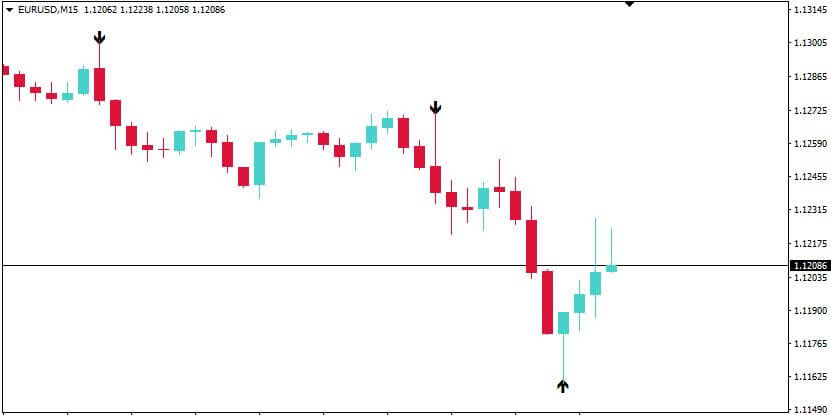
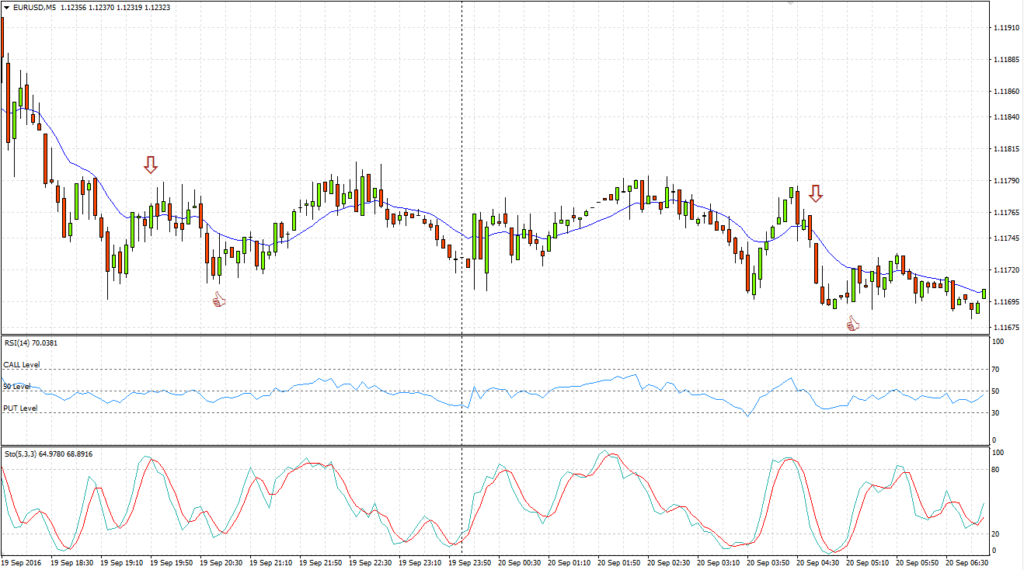
Buying a CALL option:- Binary comodo green arrow shows up on the previous candle
- Stochastic slope is in the lower part and (preferably) pointing upwards
- The blue/red line on the chart is blue and pointing upwards
- Binary comodo red arrow shows up on the previous candle
- Stochastic slope is in the upper part and (preferably) pointing down
- The blue/red line on the chart is red and pointing downwards
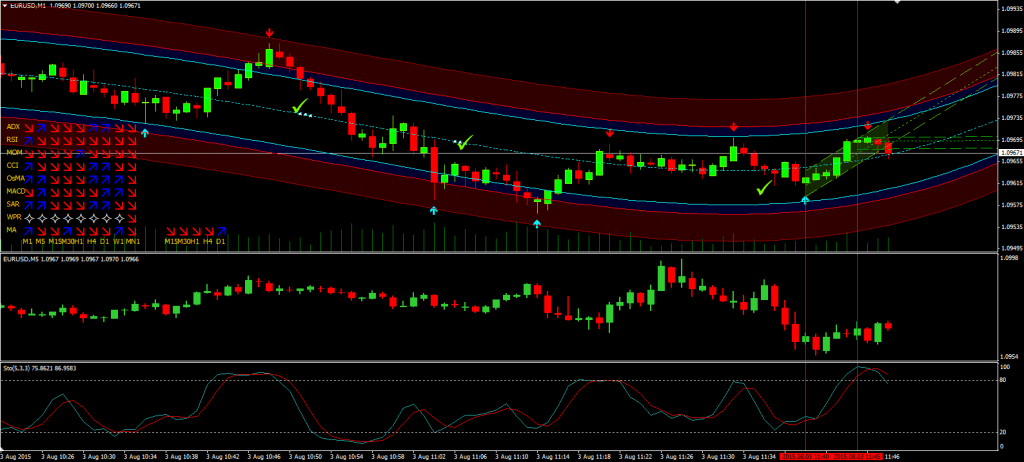
What does this strategy look like
None of the indicators in this strategy are made by us, we only think its good to use them together.
5×5 Simple System for Binary Options Trading
05:32 / by Unknown / in 15min strategy, BINARYOPTIONS, PATTERNS, Strategy / with No comments /
How does it work?
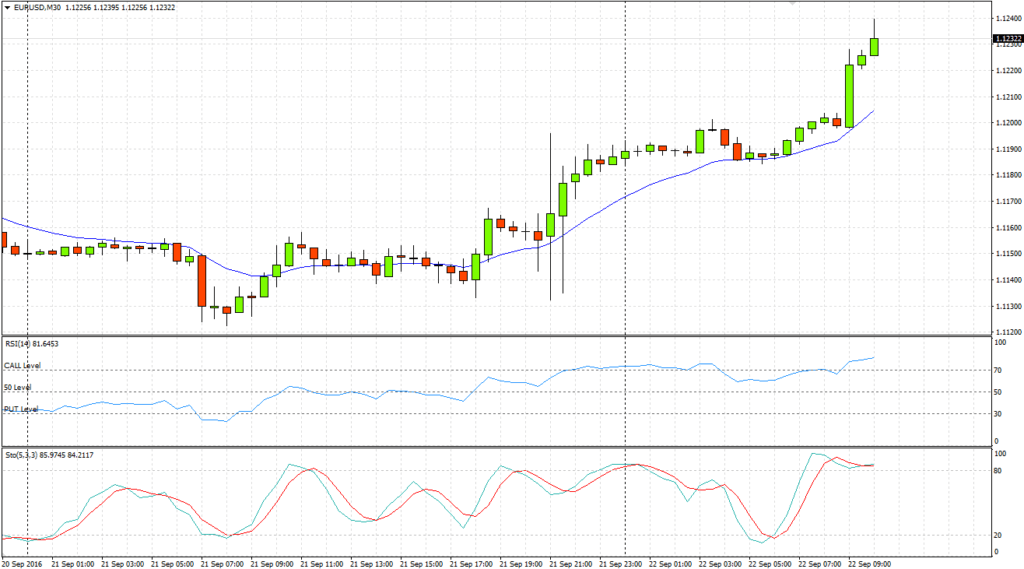
Create a chart using the two indicators 5 RSI and 5 SMA (smoothed moving average) and set a 50 horizontal line on the RSA only. Use it for monitoring a currency on a daily chart. The candle for the day must cross below or above the 5 SMA. Once the candle closes, wait for the next candle (on a daily chart this will be the next day) and wait for the movement to be 10 pips or more above or below the previous day’s high/low. When looking at calls, you would only enter if the RSI is above the 50 line or under the 50 line for put options.- For a call option: Watch the daily candle for a cross above the indicator 5 SMA and then close. On the following day, the candle needs to be at least 10 pips or more above the high of the previous day and the RSI needs to be above 50, then you can enter.
- For put option: Watch the daily candle for a cross below the indicator 5 SMA and then close. On the following day, the candle needs to be at least 10 pips or more below the low of the previous day and RSI needs to be below the 50, then you can enter.
Pros and Cons
One of the detriments of this system is the length of time to wait before being able to trade, up to 2 days or more to check if the trend is stable before trading. There is also no guarantee that even after the wait you are not entering just before a retracement. This strategy does ignore the trends to a degree, but you should ensure that you only trade with the trends and not against them to avoid losses.This strategy is easy to understand and use by anyone and it is easy to follow and remember the rules. Trading with the trend when using this strategy means you can get some good signals in the trend direction due to the SMA which is a trend identifying indicator. The RSI helps you confirm the information you need to trade. This 5×5 strategy is a good start for a trading template and adding in an indicator of your choice will help you trade binary options with this system. It is important when trading to try and keep things as simple and uncomplicated as possible.
The 5 RSI and 5 SMA that you work with in this strategy are good enough to start with. If you add in resistance and support lines you can improve the system and help you find your way to more profitable trades and fewer losses. Or look at adding in a Stochastic Oscillator to help find the resistance and support areas easier. Having to wait for days to obtain a signal with this strategy may be off-putting to some traders, but there are ways to use this strategy for lower expires. When trading on less than 4 hour expires, waiting for moves of 10 pips or more can be a problem before entering so you might not want to wait that long. Wait on a candle to close in the direction you are trading in, check the S/R lines and check the RSA is still below 50 for 4 puts and candles are still below the 5 SMA. Check the S/R lines for confirmation before trading.
Binary Options Strategy – The Zig-Zag Indicator
05:16 / by Unknown / in 5min strategy, binary option strategy, PATTERNS, Strategy / with No comments /
This specific indicator looks at long term reversal while ensuring that the price fluctuations that occur over the short term as not acted on in error. The Zig-Zag indicator is supposed to change its direction as and when the assets it is based on changes direction and moves upwards of a specific set amount. This forms the classic zig-zag pattern as it shows a series of lines zigging and zagging in the chart. This indicator is often used when trading various assets and is a coincident indicator when applied to wave analysis.
This indicator is more of a backwards looking indicator and relies on a relatively large movement before any change is visible, so it does not work well when trading over the short term (on short timeframes).
So how does it work exactly?
There are various charts used when calculating the zig-zag line.
These include mountain, dot and line charts based on prices that assets
close at. This means the zig-zag line is based on closing prices in the
same way. OHLC, candlesticks and other charts tend to show high/low
ranges of assets which makes a zig-zag line based on this range more
sensitive when prices move as opposed to those that work on the close
price only as low to high tends to be a larger range than close to
close.This indicator would need to be set as a percentage or a specific amount of a currency such as dollars. A percentage works better than a currency variance so it does not need constant adjustment for the assets depreciations and appreciations. The lines would need to be drawn from the peak of the high to the troughs lowest point or the opposite way around depending on flow. Once the line moves in the specific direction, it will stay that way until the price moves in the opposite direction by the specified percentage or value. The last line in the series could change if the price of the asset changes as it isn’t set.
+ and – of this trading strategy
This indicator is specifically for following trends and is a valid indicator to measure movement over a longer period while allowing you to negate the fluctuations that occur over a short term period. It is easy to analyse and formulate. The zig-zag goes up, the asset trend is up, the zig-zag arrows down, the asset trend is downwards. This indicator is not great for providing signals as an asset needs to make a big movement in either direction before there is any potential signal, which could be too late to make use of it.The zig-zag indicator is best used as a tool for binary trades but not used exclusively for entering the market. Short term direction is not forthcoming with this tool, it is more backwards looking. It works well as a coincident indicator and as a trend follower. When you analyse the zig-zag, it gives a clear trend indication which can help you to determine trend direction. Use it with a value or a percentage base to get an idea of its functionality.
Wednesday, 26 July 2017
Triple X – Binary trading made simple
21:29 / by Unknown / in 15min strategy, binary option strategy, PATTERNS, Strategy / with No comments /
How to setup the chart
Timeframe: M15 Template: TripleX-strategy (eDisc download, ulozto download)How does this strategy work
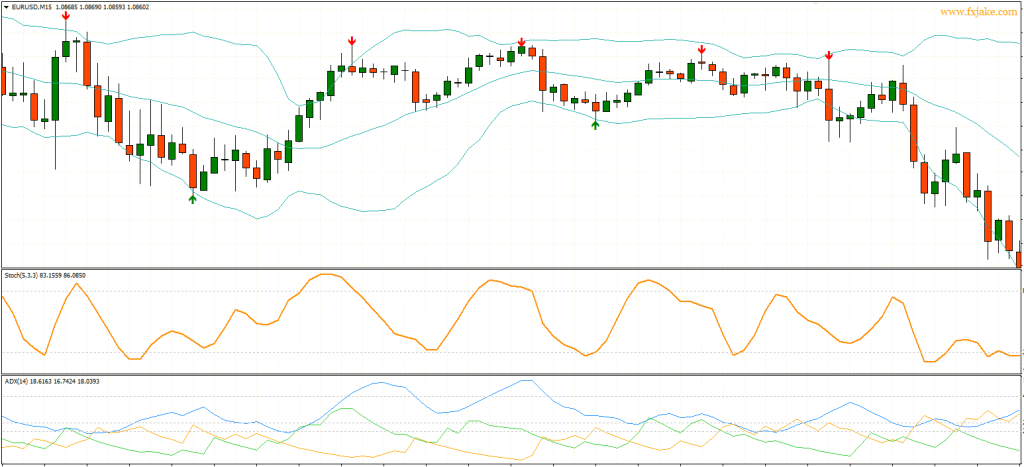
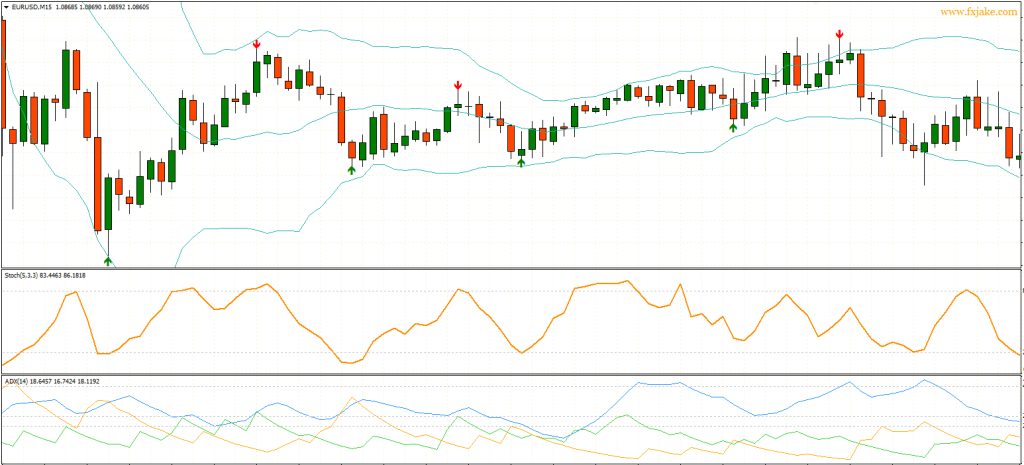
As you already know, this strategy uses 3 strong and proven indicators. Using Bollinger bands we will see when the price diverges from average. If it gets above or under the outer Bollinger lines, we can follow other indicators. Stochastic indicator shows us if price is in an overbought or in anoversold area. That helps us decide the next price movements. And most importantly: ADX shows us how strong the trend is. And how to connect these indicators into one strong strategy for binary trade? Keep on reading…When to enter the trade
Buying a CALL option:- The previous candle is falling (bearish) and is under the lower Bollinger band (ideally, there is an arrow below)
- The current candle rises back above this line
- Stochastic indicator is at around around 20 (and rising)
- ADX indicator rises above the level 25
- WE BUY A CALL OPTION WITH 30 OR 60 MINUTE EXPIRATION TIME
- The revious candle is rising (bullish) and is above the upper Bollinger band (ideally, it has an arrow above)
- The current candle falls back below this curve
- Stochastic indicates around 80 (it’s better if it’s falling)
- ADX indicator rises above 25 again
- WE BUY A PUT OPTION WITH 30 OR 60 MINUTE EXPIRATION TIME
What does this strategy look like
Results with this strategy
As you can see on the pictures, results are almost perfect. Therefore, I would say this is the best indicator strategy on the net! Try it yourselfBERSI Binary Strategy , best from 2014
21:19 / by Unknown / in 15min strategy, binary option strategy, PATTERNS, Strategy / with No comments /
How to setup the chart
Timeframe: M5 or M15 Template: BERSI (Download the strategy from: ulozto.net or edisk or even from tinyupload.com)How does this strategy work?
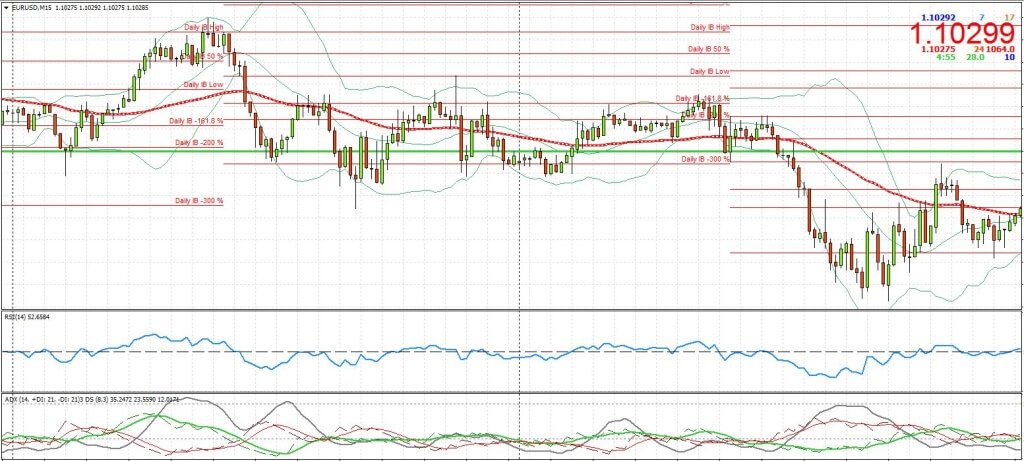
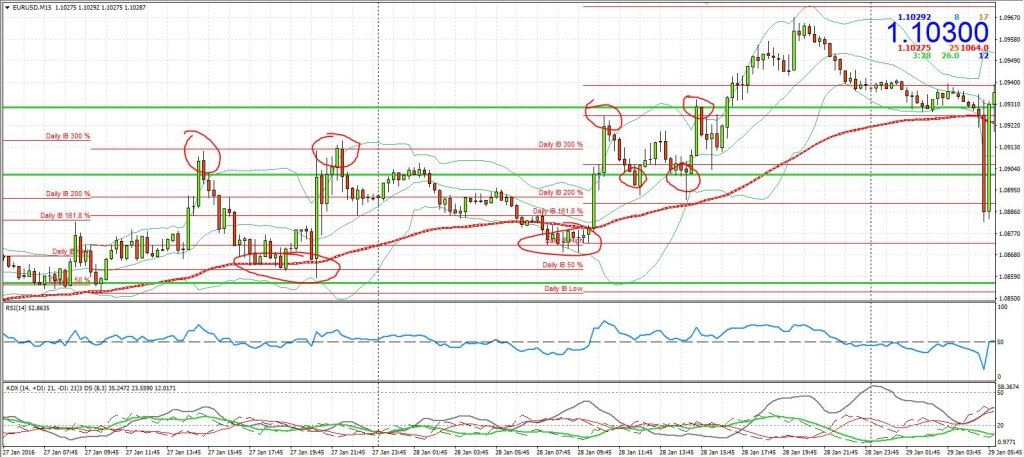
BERSI uses various indicators (i.e. Initial Balance, Sellzone, RSI oscillator and Bollinger bands). Ideal position of all indicators and some nice formation of candles such as pinbar or three line strike should guarantee us a successful trade. For a better understanding you can watch videos from strategy author himself. Only in czech language unfortunately.When to enter a trade
Buying a CALL option:- The price follows IB Daily and IB Weekly (stronger)
- RSI indicator crosses upwards middle and sellzone (red line) points upwards (uptrend)
- ADX indicator above 50
- Price follows IB Daily and IB Weekly (stronger)
- RSI indicator crosses downwards middle and sellzone (red line) points downwards (bear trend)
- ADX indicator above 50
This is what the strategy looks like
Results of trading with this strategy
You can see the results on the video.SuperSignal Binary Trading Strategy
21:07 / by Unknown / in 60sec strategy, binary option strategy, PATTERNS, Strategy / with No comments /
How to set up the chart
Timeframe: M1Template: Download the strategy ( download )
How does the template work?
This strategy uses four indicators: Super-signal-channel_alert , demark trendline, x3 semafor and 3c_JRSX_H. After adding all these to MT4, we will clearly see when to make a trade.When to enter a trade
Buying a CALL option:- Upward SuperSignal (an arrow in a circle) appears
- Buy is confirmed by RSX indicator
- Martingale can be used
- Downward SuperSignal (arrow in circle) appears
- Buy is confirmed by RSX indicator
- Martingale can be used
Strategy screenshot
Golden Eye – Trading strategy with 80 % success rate
20:55 / by Unknown / in 15min strategy, 30min strategy, binary option strategy, hourly strategy, PATTERNS, Strategy / with No comments /
Golden Eye is a strategy based on the ADX indicator (what is an ADX indicator?) which is used for confirming rebounds. This strategy works well with with M15 timeframe and the trades which are opened for 60 minutes (in direction of longterm trend) or for 30 minutes (against the trend).0 minut (proti směru).
How to setup the chart
Timeframe: M15Template: Golden Eye Strategy (Download this strategy, Download 2)
How does this strategy work
As soon as the arrow appears, we check the ADX indicator. If the current trend is strong and rebound is probable (main ADX is at around 50 or more), we will open the trade.When to enter the trade
Buying a CALL option:- Immediately after a green arrow appears
- ADX indicator has to be at least on level 25 (the more the better)
- Immediately after red arrow appears
- ADX indicator has to be at least on level 25 (the more the better)
Strategy screenshots
My results with this strategy
Results after the first week looked very promising with success rate of 83 % !!! Unfortunately, on the second week the results have gotten worse, but still the strategy keeps at 80% success rate. Highly recommended!GOD Strategy Binary Option Trade + Video
20:46 / by Unknown / in 60sec strategy, binary option strategy, PATTERNS, Strategy / with No comments /
How to set up the chart
Timeframe: M1Template: GOD Strategy (Working 2017 download)
How does this strategy work
When to enter a trade
Placing a CALL trade:- A circle appears under the current candle
- A red arrow pointing upwards appears under current or previous candle
- Stochastic indicator points upwards
- ► Open a Call trade for 60 seconds
- A circle appears above current candle
- Red arrow pointing downwards appears above current or previous candle
- Stochastic indicator points downwards
- ► Open a Put trade for 60 seconds
What does this strategy look like?
Real life video of this strategy
You can look at the video below to see how the strategy works. In the first part of the video, we tested it on EUR/USD on the 19. 1. 2017 (after midnight) and then the next day after noon.Binary Options Strategy PDF
11:06 / by Unknown / in 15min strategy, PATTERNS / with No comments /
Binary options trading is relatively a new phenomenon which is picking up at a very fast pace. The concept of this type of trading is not very complicated. You just need to study the trend and predict if the value of an asset is going upwards or downwards and trade accordingly. Your winning and losing will depend upon these predictions.
Where You can Find Binary Options Strategy on PDF?
Tuesday, 25 July 2017
BOKAY Binary Options Strategy Free Download + Video
00:52 / by Unknown / in PATTERNS, Strategy / with 2 comments /
How to set up the chart
Timeframe: M5
Template: BOKAY (Down strategy or use tinyupload) WORKING DOWNLOAD LINKS 2017
How to trade with this strategy
When to enter a trade
Buying CALL options:
- Price is in the lower channel
- Stochastic indicator points upwards
- Red arrow pointing downwards appears
Buying PUT options:
- Price is in the upper channel
- Stochastic indicator points downwards
- Red arrow pointing downwards appears
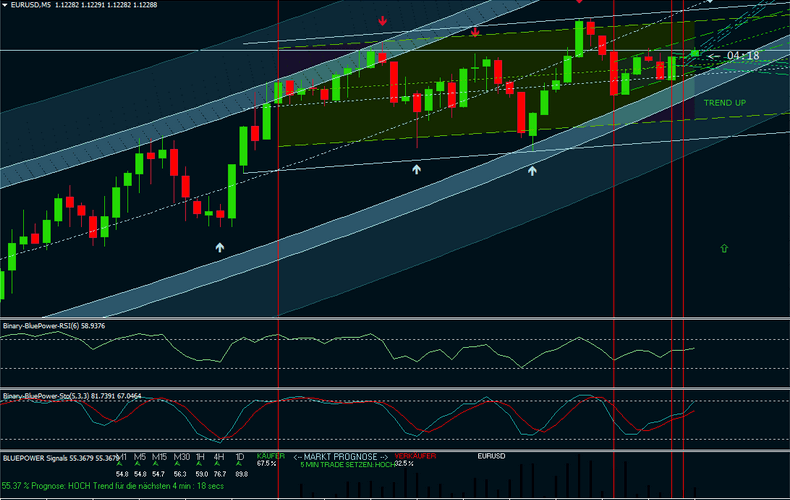
What does this strategy look like in meta trader
Binary BluePower Template
Many people want to download the BluePower template, which is the very same thing as the BOKAY template. I don’t have a download link for that strategy, I couldn’t find it, but look at the image below. It’s almost the same as BOKAY, so you don’t need to have it.
As you can see, it’s very similar. I am adding a youtube video below.
The new Binary Options strategy "Doubles!"
00:46 / by Unknown / in PATTERNS, Strategy / with No comments /
Doubles strategy uses Bollinger bands which you may know already. Additionally, it also uses the MACD indicator which is suitable for binary option trade. And how do these indicator get along? Read on.
How to set up the chart
Timeframe: M5
Template: Stáhnout strategii uloz.to edisk.cz
How does this strategy work
With this strategy, we are waiting for the price to enter and the current candle to close in the area between two outer Bollinger bands. Afterwards, we wait for a correction in direction of anticipated price progress and confirm this turn using MACD indicator. Strategy is very simple, but successful!
When to enter the trade
Opening a CALL option:
- If the previous candle closed between the bottom green and violet Bollinger line.
- The low of the previous candle did not get under green Bollinger curve.
- MACD chart points upwards.
- We will enter a call trade on next candle for 10-15min.
Opening a PUT option:
- Previous candle closed between upper green and violet Bollinger curve.
- Previous candle’s high did not get above green Bollinger curve.
- MACD indicator points downwards.
- We will enter a trade on next candle for 10-15min.
What this strategy looks like
Nithoos Binary options strategy – 75% success rate
00:40 / by Unknown / in PATTERNS, Strategy / with 4 comments /
How to setup the chart
Timeframe: M5
Template: !!!!!!!!!!!!!!!!!!!Nithoo-1.tpl
How does this strategy work
This strategy was created by an experienced trader. The strategy consists of 4 indicators and an easy to understand template. You just pay attention to when the indicators show a clear signal to buy an option with 10 – 15 minutes expiration time. (According to your discretion and signals 🙂 ) It is recommended to use Fibonacci retracement for additional signal confirmation.
When to enter the binary trade
Buying a CALL option:
- RSI indicates market oversel
- Cycle Spike indicator shows an arrow pointing down and a blue rectangle
- We will open a 10-15min trade on the next candle
Buying a PUT option:
- RSI indicates market overbuy
- Cycle Spike indicator shows an arrow pointing up and a red rectangle
- We will open a 10-15min trade on the next candle
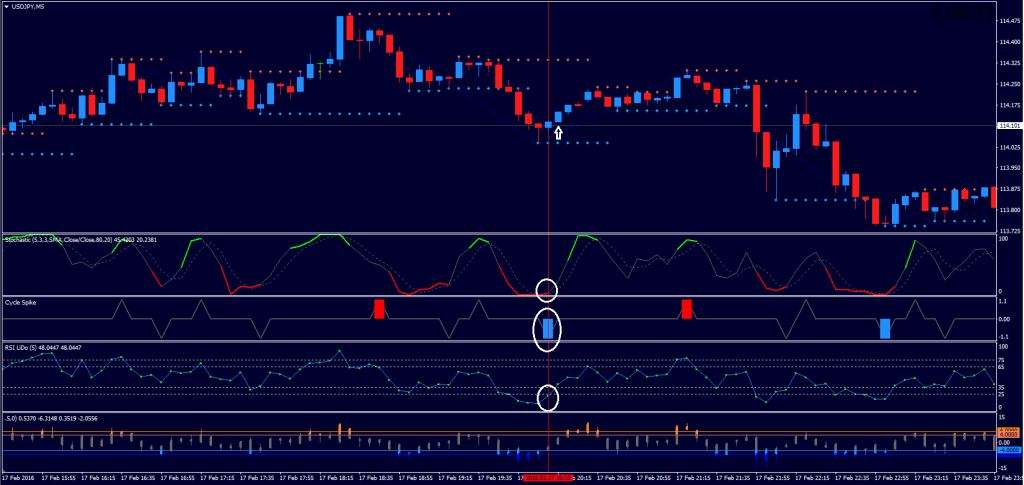
Strategy screenshot from META TRADER
Binary trading with BOSTS_1 indicator
00:36 / by Unknown / in PATTERNS, SCHOOL / with 1 comment /
Trading using BOSTS_1 indicator is very simple, however it is not without risks. You may have seen this indicator before as it is usually a part of more complex strategies. According to our experiences, this indicator works using Bollinger bands. It is trend indicator, therefore you don’t need to use trends if you use BOSTS_1.
We, however, recommend to use manually drawn lines of support and resistance. This indicator repaints itself, therefore is more suitable only as a support indicator – not the main source of signals
We will trade according to arrows drawn by this indicator
How to setup the chart
Timeframe: M5
Template: BOSTS_1 (Download it here: ulozto.net)
Binary options strategies and their accuracy
Trading according to some strategies may be a good start on how to learn binary options trade. However, it is not recommended to use only simple indicators.
Always use your experience and gut feeling, in addition to indicators!
BOSTS_1 binary strategy looks as following
MARSI Binary options Strategy – Gaps and other trade signals with 90% success rate
00:32 / by Unknown / in PATTERNS, SCHOOL / with 8 comments /
MARSI is a strategy that uses the lines of support and resistance. These are drawn automatically and we only need to pay attention when an arrow appears.
How to setup the chart
Timeframe: M5
Template: MARSI Strategy (Download this binary options strategy here; or download it here)
How does this strategy work
As soon as an arrow appears, we need to confirm that this is a real signal (The RSI indicator line is above or below 50, depending on the type of signal) – afterwards, open a trade for 3 times the timeframe. If you are using M5 timeframe, open a 15 minute trade. If you’re using M1 timeframe, the expiration time will be 3 or 5 minutes.
When to enter a trade
Entering a CALL trade:
- Current candle is rising (black)
- Green arrow is under previous candle
- RSI indicator on current candle is below 50
Enterint a PUT trade:
- Current candle is falling (white)
- Red arrow is above previous candle
- RSI indicator on current candle is above 50
Binary options MARSI strategy screenshots
Our results with this strategy
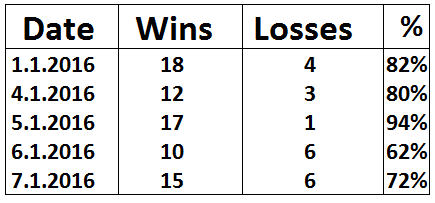
We have tested this strategy for a couple of days and the success rate was 78 %, which is not bad at all. If you want, I recommend this strategy to you. You can have a look at more detailed statistics underneath.
BOSS Indicator – Binary Options Strategy
00:27 / by Unknown / in PATTERNS, Strategy / with No comments /
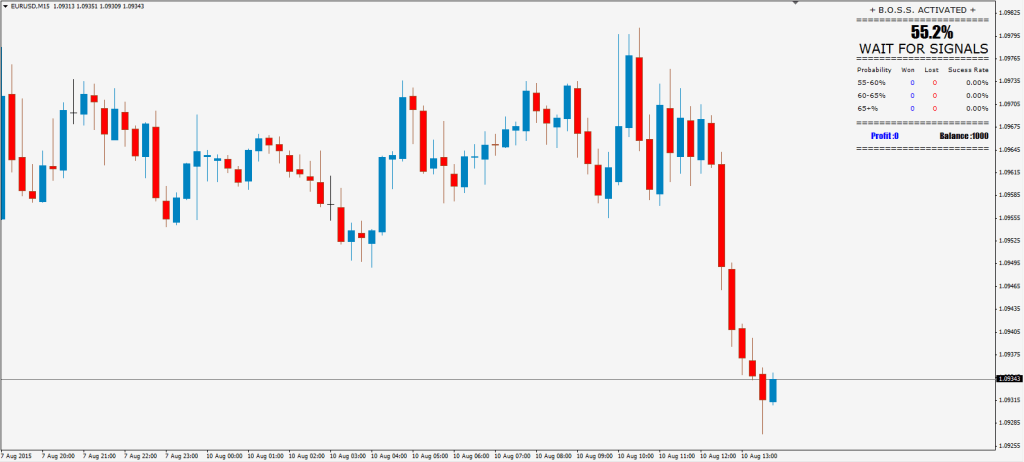
BOSS Strategy is, according to our sources, the first stratégy ever to be invented for MT4 exclusively for binary option trade. It uses inputs from all available indicators in all configurations and even calculates signal effectiveness from historical data. It’s a paid strategy, but we are giving it to you completely for free!
How to setup the chart
Timeframe: M5
Template: !BOSS Strategy (Download the BOSS strategy)
How does this strategy work
Various algorithms with unknown weights are used. What is known is that it largely uses Fibonacci retracement. Try it yourself. If you draw fibonacci line (how to draw fibonacci lines) yourself, you will see that signals often appear when approaching one of the lines.
When to enter the trade
Buying a CALL option:
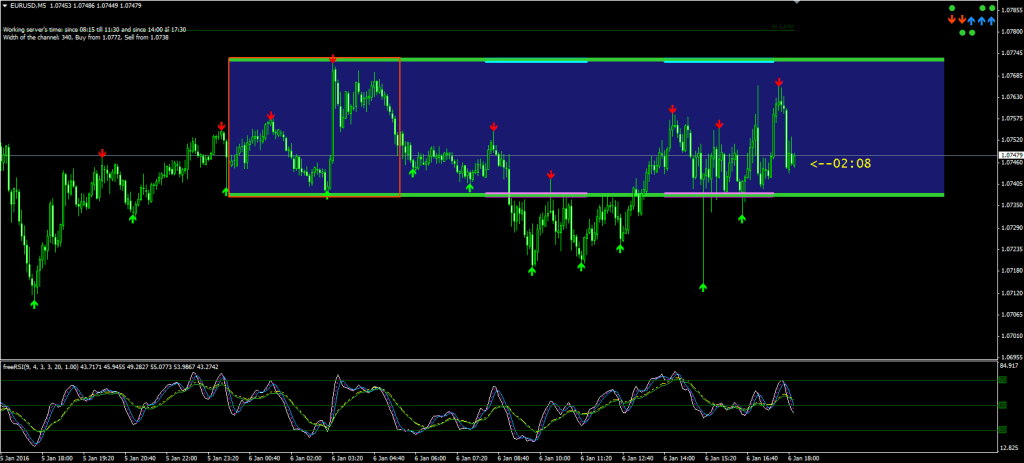
- Arrow appears under actual candle
Buying a PUT option:
- Arrow appears above actual candle
What does this strategy look like (video)
Binary Options ‘3’ Strategy That Works + Video 80% success rate
00:23 / by Unknown / in PATTERNS, Strategy / with No comments /
While we go haywire finding a reliable trading system, we tend to miss out on the obvious. Three indicators strategy ensures high potential profits as it produces exact entry signals confirmed by 3 indicators. Moreover, it can be used with all sorts of currency pairs. This strategy that works is based on three most popular indicators; Relative Strength Index, Simple Moving Average and Full Stochastic Oscillator. You can think of trading binary options on much higher level when you’ve integrated these indicators.
Download the strategy, that works
Download indicators and templates: eDisk and Uloz.To
Watch the video below to see how the strategy works
However, there is no denial of the fact that every trader comes across a situation in which one indicator that is used by almost all the traders, sometimes show inaccurate signals. So, using additional indicators will help in filtering out the false signals. Read on to learn about the three different indicators that just work mentioned above.
Relative Strength Index
The so called ‘RSI’ focuses on the price direction, unlike the ones that mostly look at the overbought or oversold price. In this binary options trading strategy the RSI level 50 decides whether the trend is bearish or bullish. If the RSI is more than 50, then a rise in the price is expected.
However, call option buying will occur if the RSI value is more than 50, but lesser than 70. On the contrary, buying put options is suggested if the RSI value falls somewhere between 30 and 50.
Stochastic Indicator Signals
Not only is it very well known for oscillation, but also for its technical analysis capabilities. The direction of the oscillator coincides with the price movement direction. You need to find stochastic between 20 and 80 as this will let you know about the present overbought or oversold asset.
Personally I like to filter signals in two ways with this indicator:
- either: Stochastic crosses 80 (for put) or 20 (for call) line
- or: Stochastic is pointing upwards (for call) or downward (for put)
Moving Average
Different strategies developed at the intersection of Moving Average with so many different periods shows the right moment during which the market has taken an unambiguous direction, whereas the traders have decided to either purchase or sell an asset.
There’s a ton of strategies including Moving averages. For example:
- EMA Rainbow Strategy for binary options
- Binary Options Trading Reversals – EMA, MACD and RSI Strategy
Combining all these will result in a great strategy!
Video: Testing the strategy, that works
In the video below, you can see a few testing trades with this strategy. Let me know in the comments if you like it!
EMA Rainbow Strategy for binary options with 70-80% rate
00:12 / by Unknown / in PATTERNS, Strategy / with 1 comment /
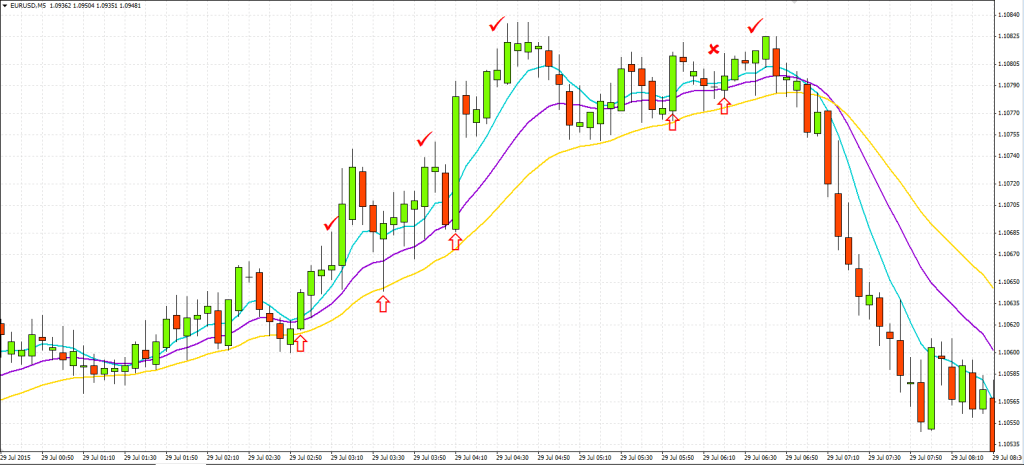
Blue moving average is on top and golden is on the bottom.This strategy uses only one indicator and that is good old Moving Average which you may have already used and know about it. We will use three EMA (Exponential Moving Average) set to 6, 14 and 26 colored differently to determine the trend and find opportunities to open high/low trades. We are using M5 timeframe and place trades with 15 minute expiration times.
How to setup the chart
Timeframe: M5
Template: EMA Rainbow Strategy (Download from here)
How this strategy works
When to open trades
Buying CALL option:
- Blue indicator moving average is on top and golden is on the bottom.
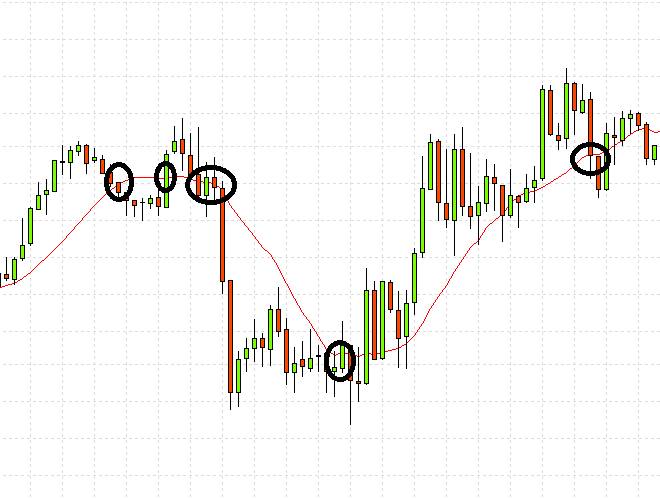
- Price moves to violet moving average from the top and crosses it. If one of two other candles rises and crosses above violet moving average again, we buy 15 minute CALL.
Buying PUT option:
- Golden moving average is on top and blue is on the bottom.
- Price moves to violet moving average from the bottom and crosses it. If one of two other candles declines and crosses below violet moving average, we buy 15 minute PUT.
How does this strategy look like
Try this strategy on a demo account
This strategy can be easily tested on demo account. Open demo account for binary option trading here (binary option demo account) and you can start trading on a demo account immediately. For example, broker topoption offers demo account only after initial deposit
Strategy video
This guy on a video below shows how to use this strategy, so enjoy.
On the video below, made by the broker IQ Option the same strategy is used.
15 min GEEK Strategy of Moving Averages with 80% success rate for Binary Option
00:06 / by Unknown / in PATTERNS, SCHOOL / with No comments /
One of the easiest ways to trade the forex markets is by using a moving strategy. While this strategy may be simple, the moving average needs to be exponential. This ensures you accomplish the right trades sooner and you squeeze a little more out of the prices. You can improve this system by adding a moving average. In this way, you can measure extremes as well as get information from crossovers. Let’s look at a 30 bar exponential moving average to demonstrate and use 2 time frames, 30 minutes and daily. The moving average will be kept at 30 bars for both time frames.
We also have a similar strategy using MA, called the Rainbow Strategy:
EMA Rainbow Strategy for binary options
Blue moving average is on top and golden is on the bottom.This strategy uses only one indicator and that is good old Moving Average which you may have already used and know about it. We will use three EMA (Exponential Moving Average) set to 6, 14 and 26 colored differently to determine the trend and […]
Why use a moving average?
Measuring average prices over a period of time is a excellent way to gauge market strength and the current trend. Moving averages allows you to do this and can also be used to create the basis for a technical analysis. Moving averages are also referred to as a rolling mean. When the moving average is plotted alongside current pricing, the data produced measures trend. When prices hit higher levels, the moving average escalates as well and decreases when prices close lower. To ensure the exponential moving average offers value as a current indicator, the older data has less weight than the newer information gained.
So how does it work?
Working on 2 separate time frames and an exponential moving average of 30 days you can begin to pick up trends. The longer time frame will show an underlying trend which can be used as a foundation. When you work on the daily time frame, you can see when the trend is bullish (above the moving average) or bearish (below the moving average). It is important to note, that while this is an indicator, other factors should be taken in to consideration such as the resistance, support and the long term trend. If the price has been above the moving average for quite some time and is nearing it’s long term resistance, be more cautious than if it has just moved above the resistance and is appearing to be on an upward trend.
Once you are sure of the underlying trend and you have ascertained that it is not about to reach a turning point, you can start working on a 30 minute bar chart. After around 10 days you would have a good view of support/resistance and the trend.
It can take quite a few hours to receive confirmation. Check the daily charts before continuing. Limit expiration from 1-4 hours. Signals may not also develop on a daily basis, but you may receive more than one in a single day. Your expiration will be shorter the closer the turning point seems to be. When the market is bullish, once the asset reaches above the 30 bar exponential moving average, this will be the signal to buy. You may miss the first signal and possibly take a loss on the final signal, but the signals in between should make up for it and help you achieve success.
This system works, it is a simple technical analysis which most traders in the current market place and often forms the basis for upper level, more complicate techniques. For amateur traders, this strategy is a good place to start. You need to learn the basics of technical analysis to understand the markets and a moving average system will help you with this skill. You should be able to achieve results on a consistent basis when you apply this strategy properly.
15-30 Minute Strategy, Simple and Profitable
00:02 / by Unknown / in 15min strategy, binary option strategy, IQOPTION, PATTERNS, Strategy / with No comments /
Start off by adding:
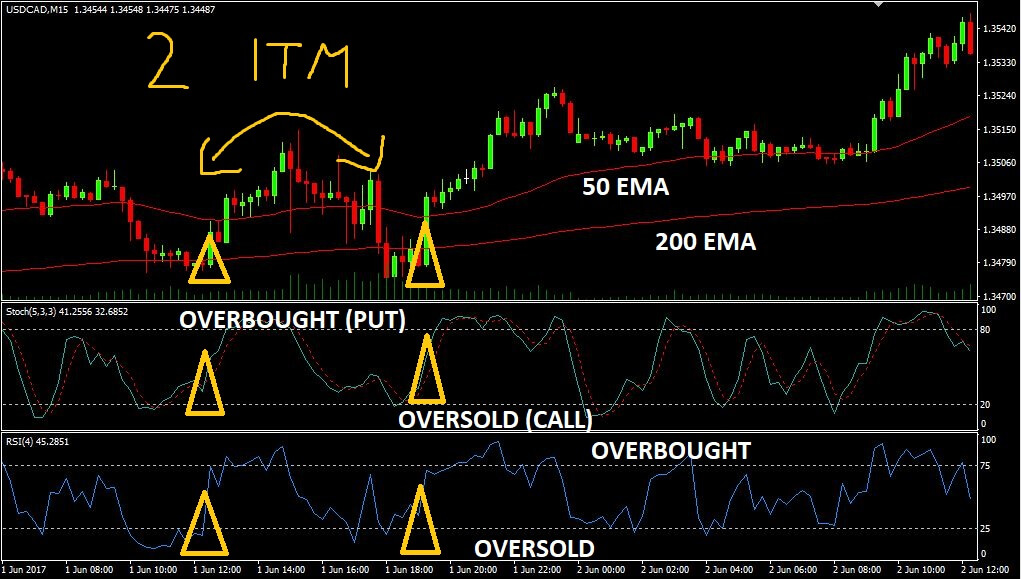
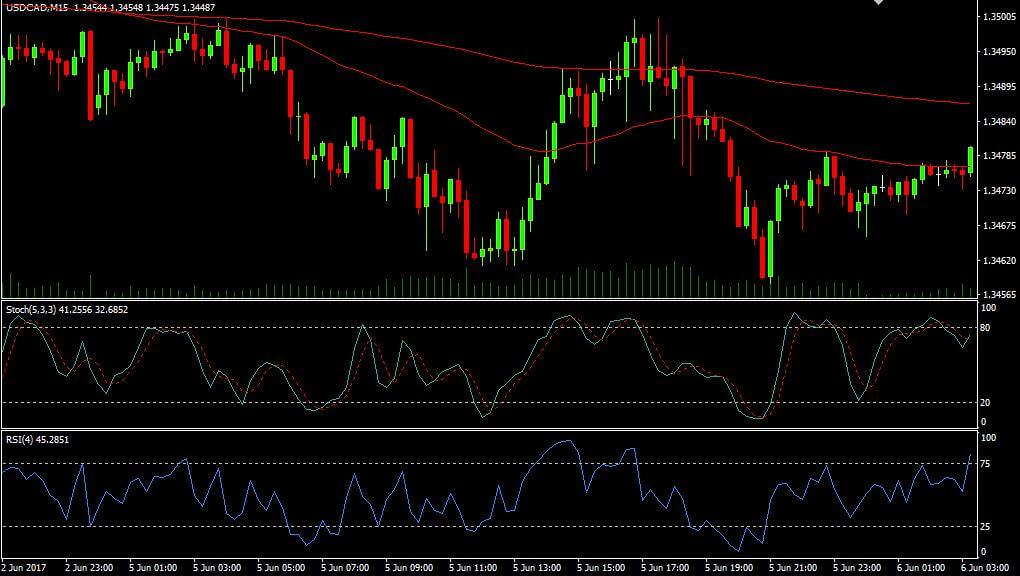
- Two exponential moving averages: on the periods 50 and 200. You can also add on 21 but not essential at this point.
- Add the Stochastic Oscillator (5,3,3) with levels of 80 and 20.
- Set the RSI value at 4 and add to levels 25 and 75.
- After this you can add the indicator FiboPiv. This indicator draws your support and resistance lines on the chart with a high degree of accuracy.
For beginners it is wise not to trade too near the lines until they understand price action. Amateurs would also need to understand the pivot-line to trade near S/R lines. Price is often undecided when it is around the pivot line and identifying a trend becomes difficult. It takes time to understand how price reactions change near major S/R lines but once you do they become advantageous in your trading.
How does it work?
Use your moving averages to help identify a trend. Go to the 15 minute chart and check the candlesticks. Are they above the 200 EMA and 50 EMA or possibly below both the 200 EMA and 50 EMA? To ensure the trend is true and not about to change direction suddenly, make sure you know what the previous highs and lows were. The stochastic oscillator can help you identify these by showing the oversold and overbought levels. If the price is stepping down and shows under both the 50 and 200 EMA, look for lower highs and lower lows. If the price is buys stepping up it would be creating higher lows and higher highs above the 50 and 200 EMA. The point is to find these little steps, which are small retracements within the current trend.
- To open a call option, candlesticks need to be above the 50 and 200 EMA and show as oversold on the RSI and Stochastic, enter at higher lows.
- To open a put option, candlesticks need to be under the 50 and 200 EMA and show as overbought on the RSI and Stochastic, enter at lower highs.
Once you have confirmed the trend action, as a newcomer, you will be trading mechanically. You would see the candles form the lower high and see that the RSI and Stochastic are close to overbought levels. Let the bullish 15 minute candle complete and ensure the retracement is over. Double check that the bullish move is done by looking at the 5 minute chart and see if the next candle is bearish.
Once you are more experienced and understand candlesticks and price action and are able to draw resistance and support lines and have a good idea of the volatility of the market you can change your approach using this strategy. You would not wait for the bearish candle to form but would look at the 1 minute chart and draw your S/R lines. Makes sure the M5 and M15 are still overbought though. You would use price action to determine when to trade and would not have to wait for candles to complete at 5 minutes in the direction of trade you want to trade in. Price did not continue an upward climb shows the retracement had ended so you would have a better entry. Use the same option when working on call options, just work on higher lows and higher highs.
Why to use this strategy or not
This strategy is developed to work in most market conditions but will not work in every market condition. It is best for you to wait until all the current market conditions are showing the results you need before trading. This can sometimes take days but it is best to wait to avoid bad trades. It can be a little difficult for beginners to find the better entries as well. This strategy does give enough confirmations to make you feel more secure in trades. This strategy is fairly accurate and it helps you learn price action skills which are endlessly beneficial for trading.
Monday, 24 July 2017
Euro settles near two-year highs; outlook bullish
08:57 / by Unknown / in dollar falls, NEWS / with No comments /
* PMI data helps broader euro zone story; FX eyed
* Bets on a weaker dollar rise to highest since Feb 2013
* Graphic: World FX rates in 2017 http://tmsnrt.rs/2egbfVh
By Saikat Chatterjee
LONDON, July 24 (Reuters) - The euro rose to a 23-month high against the dollar on Monday as investors remained bullish after latest business growth data for July pointed to only a mild slowdown, suggesting the euro-zone economy was still growing at a relatively strong clip.
IHS Markit's Euro Zone Flash Composite Purchasing Managers' Index for July, seen as a good guide to economic growth, fell to 55.8 from June's 56.3, still comfortably above the 50 level that separates growth from contraction. data calmed some concerns that the euro's strength this year EUR=EBS has hurt growth prospects in the euro zone.
In a note after the data, Citigroup (NYSE:C) strategists said "the level of the composite PMI remains high and its sub-components, i.e., strong job creation, firms' sustained optimism and solid pace of activity in services, suggest continued resilience of the euro area recovery".
The single currency was trading at $1.16465, slightly below a high of $1.16840 hit earlier in the day, a level last seen in August 2015. It is the best performing pair in the G10 FX space, up more than 10 percent so far this year.
The euro's rise has also not invited criticism from policymakers, prompting some investment banks to come out with bullish calls. JP Morgan, for example, recommends staying long euros and buy short-dated FX calls vs the U.S dollar.
European Central Bank President Mario Draghi said on Thursday that financing conditions remained broadly supportive, and noted that the euro's appreciation had "received some attention". However, he did not cite that as a problem nor did he directly try to talk the currency down. market positioning also paint a bullish outlook for the euro. One year risk-reversals EUR1YRR=FN on the euro are nearing their highest levels since October 2009.
In contrast, the U.S. dollar has been hit by softening US yields and weak data.
Speculative "short" bets against the U.S. dollar reached the highest since February 2013 NETUSDALL= last week, according to calculations by Reuters and Commodity Futures Trading Commission data released on Friday.
"A weaker dollar seems to be the path of least resistance given the soft data coming out of the U.S. and the political uncertainty," said Michael Hewson, chief markets strategist at CMC (NS:CMC) Markets in London.
On Monday, the dollar index .DXY , measuring the currency's strength against a basket of other currencies, fell to 93.823, its lowest level since June 2016. It recovered somewhat to be up 0.1 percent on the day at 93.96.
Investigations into alleged Russian meddling in the 2016 U.S. presidential election and whether there was collusion with President Donald Trump's campaign are viewed as obstacles to the administration's plans to boost economic growth and a negative for the dollar. expect little relief for the dollar in a week marked by the U.S. Federal Reserve's regular meeting on policy, with the index on track to test the June 2016 lows of 93.451
For Reuters Live Markets blog on European and UK stock markets see reuters://realtime/verb=Open/url=http://emea1.apps.cp.extranet.thomsonreuters.biz/cms/?pageId=livemarkets
U.S. dollar wallows near 13-month lows
08:39 / by Unknown / in dollar falls, NEWS / with No comments /
Investing.com - The U.S. dollar was nursing losses near 13-month lows against a currency basket on Monday, as sentiment on the greenback remained negative amid political uncertainty in Washington.
The U.S. dollar index, which measures the greenback’s strength against a trade-weighted basket of six major currencies, was at 93.84 by 10.47 a.m. ET (02.47 p.m. GMT) after touching 93.65 overnight, its lowest since June 22, 2016.
Worries over policy direction from the White House and Capitol Hill since last week’s failed attempt to overhaul healthcare and investigations into alleged links between President Donald Trump’s campaign and Russia in last year’s election have fed into dollar weakness.
The failure to pass healthcare reform has dampened hopes for the passage of Trump’s other legislative efforts, such as overhauling the tax code and implementing fiscal stimulus.
Political developments remained in the spotlight on Monday following reports that Trump was set make a statement on health care at 3:15 p.m. ET.
Hopes for tax reforms and fiscal stimulus under the Trump administration helped drive the dollar to a 14-year high after the November election. The dollar has now given up all of its post-election gains.
Doubts over the Federal Reserve’s plans for a third rate hike this year have also pressured the dollar lower.
The Fed is to hold its next meeting on Wednesday and is widely expected to hold policy steady. Officials may also give some insight into its plans to start normalizing its balance sheet.
The euro was slightly lower against the dollar, with EUR/USD slipping to 1.1638, after touching a 23-month high of 1.1684 earlier.
Demand for the euro was underpinned by expectations that the European Central Bank is moving closer to tapering its bond-buying program.
The euro came off the day’s highs after data pointing to a slowdown in euro area private sector growth at the start of the second half of 2017.
The dollar slid to five-week lows against the yen, with USD/JPY falling to 110.62. it was last at 111.00.
Sterling pushed higher against the greenback, with GBP/USD rising 0.25% to 1.3025.
The Canadian dollar hit fresh 14-month highs, with USD/CAD falling 0.3% to 1.2501.
The loonie was boosted by official data showing that Canadian wholesale trade rose more than expected in May and higher prices for oil, a major Canadian export.
Bitcoin ticks higher, Ethereum steady in muted trade
08:35 / by Unknown / in bitcoin, ethereum, news / with No comments /
Investing.com - Bitcoin prices ticked up on Monday in muted trade, while the price of Ethereum, Bitcoin's closest rival in terms of market cap was little changed.
On the U.S.-based GDAX exchange, Bitcoin rose to $2,754.8, up $36.1 or 1.33%.
Demand for Bitcoin continued to be underpinned after it avoided a split into two independent currencies last week when its network supported upgrading to its software in order to process transactions more quickly.
The upgrade to bitcoin's network will not take place until autumn, according to reports.
Bitcoin prices rallied last week, rising to a high of $2,953.5 on July 19, just shy of its record high of $3,000 set in June.
Meanwhile, Ethereum was almost unchanged for the day at $227.40, remaining well below its all-time high of $419.3.
The pullback in Ethereum from its all-time high has seen its market capitalization fall to $20 billion, well below Bitcoin’s $43 billion, reducing investor expectations that Ethereum would be the alternative digital currency that usurps Bitcoin as the best capitalized cryptocurrency.
To stay on top of the latest moves in the crypto-space, be sure to check out: https://www.investing.com/crypto/
Sunday, 23 July 2017
Comdoll Trading Kit (July 24-28, 2017): Market Preview
23:04 / by Unknown / in BLOG / with No comments /
Will comdolls keep climbing against the dollar this FOMC week? Here’s a couple of short-term pullback plays I’m looking at and a new big breakout.
But first, here’s a quick look at the potential support and resistance levels:
AUD/USD | USD/CAD | NZD/USD | |
---|---|---|---|
Week Open (WO) | 0.7908 | 1.2541 | 0.7448 |
Previous Week High (PWH) | 0.7988 | 1.2702 | 0.7459 |
Previous Week Low (PWL) | 0.7784 | 1.2522 | 0.7260 |
Top Weekly ATR (tWATR) | 0.7975 | 1.2635 | 0.7519 |
Bottom Weekly ATR (bWATR) | 0.7842 | 1.2447 | 0.7387 |
Other significant levels | 0.7800, 0.7900 | 1.2500, 1.2600 | 0.7300, 0.7500 |
In case you’re wondering what ATRs are all about and how I computed those figures, make sure you check out my entry explaining my trading strategies.
Here are some of the comdoll forex setups I’m looking at this week:
AUD/USD: 4-hour
After the recent triangle upside breakout on AUD/USD’s daily time frame, I’m now hoping to catch a quick correction to join this pair’s uptrend.
A rising trend line can be drawn to connect the price lows since the start of June, and this could act as near-term support. Applying the Fib retracement tool on the latest swing low and high shows that the 61.8% level is close to this trend line.
Stochastic is making its way down to show that sellers are taking control of price action, but buyers could regain the upper hand once the oscillator reaches oversold territory. The 61.8% Fib also coincides with a former resistance level that might now hold as a floor.
USD/CAD: 1-hour
There seems to be no stopping the Loonie’s rally! With price breaking another key support zone, I’m zooming in to the 1-hour chart to spot opportunities to short.
I’m seeing a descending channel that’s been holding since mid-July and price is currently bouncing off support. Stochastic is nearing oversold conditions so buyers might return soon, taking USD/CAD back up to the channel resistance just below the 1.2600 handle.If the top of the channel continues to keep gains in check, price could be due for yet another test of support close to the 1.2500 mark. The FOMC decision is coming up, though, and this could mean more volatility than usual for this one!
NZD/USD: Daily
It turns out last week’s upside channel breakout was just a prequel for another one! NZD/USD just busted through the ascending triangle resistance visible on the daily chart to confirm that more gains are in the cards.
There may be some buying pressure left as stochastic is still pointing up, but the oscillator is dipping into the overbought zone to signal that Kiwi bulls might need to rest. If so, a retest of the broken resistance around the .7350 minor psychological mark could take place before the rally gains traction.
Cheers,