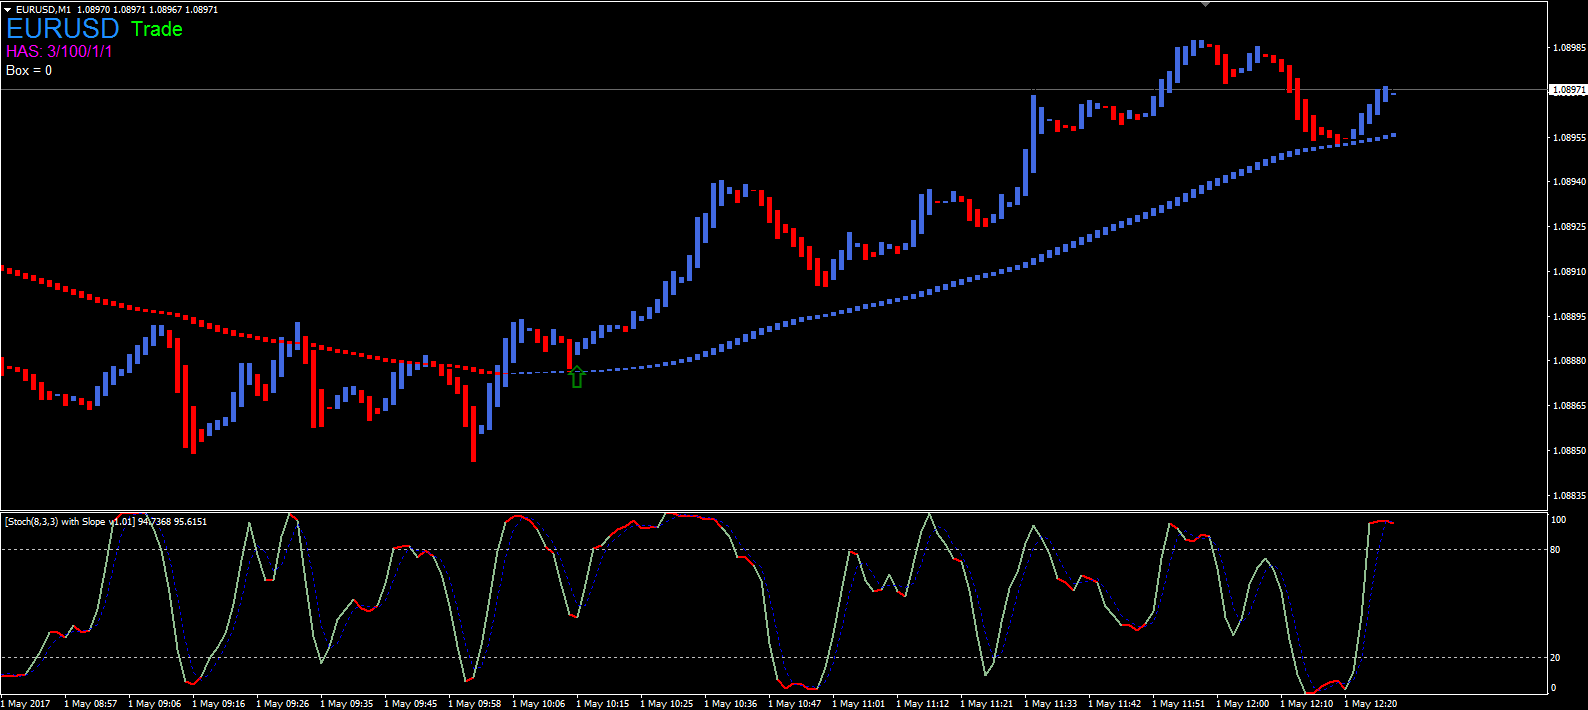
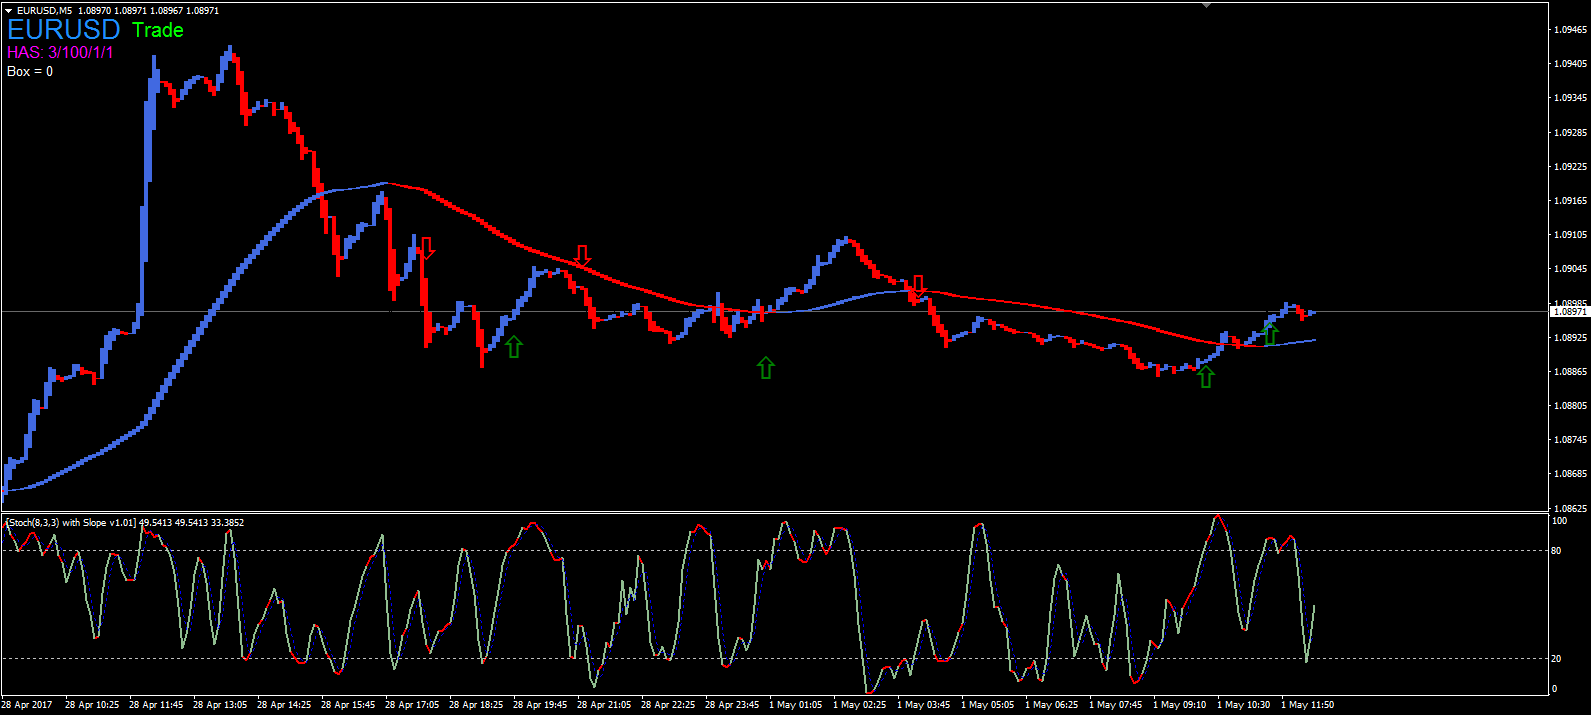
When looking at indicators that follow trends and those that are used
in “wave analysis”, the Zig-Zag indicator is one that comes to mind. It
works on excluding fluctuations over the short term and measures trend
retracement. So
how does it work with binary options?
This specific indicator looks at long term reversal while ensuring
that the price fluctuations that occur over the short term as not acted
on in error. The
Zig-Zag indicator is supposed to
change its direction as and when the assets it is based on changes
direction and moves upwards of a specific set amount. This forms the
classic zig-zag pattern as it shows a series of lines zigging and
zagging in the chart. This indicator is often used when trading various
assets and is a coincident indicator when applied to wave analysis.
This indicator is more of a backwards looking indicator and relies on
a relatively large movement before any change is visible, so it does
not work well when trading over the short term (on short timeframes).

So how does it work exactly?
There are various charts used when calculating the
zig-zag line.
These include mountain, dot and line charts based on prices that assets
close at. This means the zig-zag line is based on closing prices in the
same way. OHLC, candlesticks and other charts tend to show high/low
ranges of assets which makes a zig-zag line based on this range more
sensitive when prices move as opposed to those that work on the close
price only as low to high tends to be a larger range than close to
close.
This indicator would need to be set as a percentage or a specific amount of a currency such as dollars.
A percentage works better than a currency variance so it does not need
constant adjustment for the assets depreciations and appreciations. The
lines would need to be drawn from the peak of the high to the troughs
lowest point or the opposite way around depending on flow. Once the line
moves in the specific direction, it will stay that way until the price
moves in the opposite direction by the specified percentage or value.
The last line in the series could change if the price of the asset
changes as it isn’t set.
+ and – of this trading strategy
This indicator is specifically for following trends and is a valid
indicator to measure movement over a longer period while allowing you to
negate the fluctuations that occur over a short term period. It is easy
to analyse and formulate. The zig-zag goes up, the asset trend is up,
the zig-zag arrows down, the asset trend is downwards. This indicator
is not great for providing signals as an asset needs to make a big
movement in either direction before there is any potential signal, which
could be too late to make use of it.
The zig-zag indicator is best used as a tool for binary trades but
not used exclusively for entering the market. Short term direction is
not forthcoming with this tool, it is more backwards looking. It works
well as a coincident indicator and as a trend follower. When you analyse
the zig-zag, it gives a clear trend indication which can help you to
determine trend direction. Use it with a value or a percentage base to
get an idea of its functionality.

 As we said above, it’s good to be used with M1 or M5.