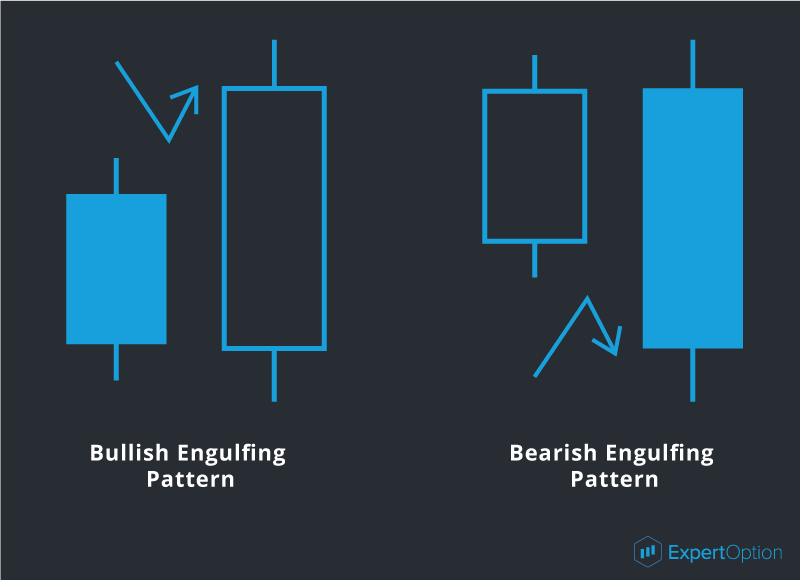
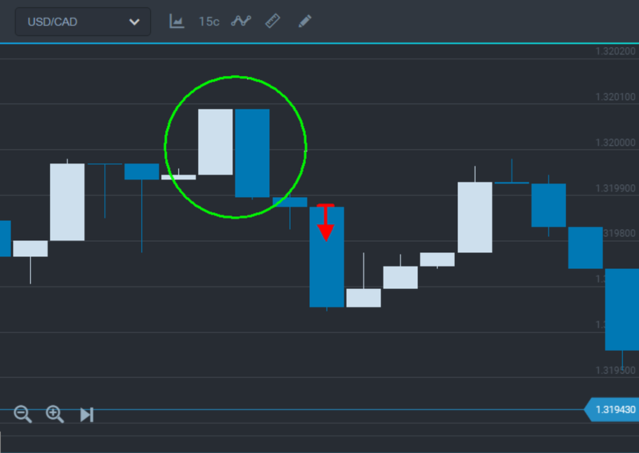
This pattern signalizes about reversal of the price movement. We see this signal after a candlestick has appeared and its body is bigger than the previous reversal candlestick. This is an engulfing candlestick. When this signal appears we should be prepared and see where the next candlestick will move. If the candlestick has the same direction as an engulfing pattern you can open a deal after its closing.
A procedure after a signal appearance:
1) See a bigger candlestick in opposite direction to a previous candlestick;

2) Wait for appearance of a new candlestick confirming a direction;
3) Open a deal in the engulfing direction after closing a new candlestick.

Buying a put after a bearish engulfing pattern
The bigger engulfing candlestick is the stronger price movement will be after reversal. In this case if you have some profit you can risk and buy an option after closing a strong engulfing candlestick. But remember you should always wait for confirmation of candlestick signals.
What is a 'Bullish Engulfing Pattern'
A bullish engulfing pattern is a chart pattern that forms when a small black candlestick is followed by a large white candlestick that completely eclipses or "engulfs" the previous day's candlestick. The shadows or tails of the small candlestick are short, which enables the body of the large candlestick to cover the entire candlestick from the previous day.
Bullish Engulfing Pattern
BREAKING DOWN 'Bullish Engulfing candlestick Pattern'
As implied in its name, this trend suggests the bulls have taken control of a security's price movement from the bears. This type of pattern usually accompanies a declining trend in a security, suggesting a low or end to a security's decline has occurred. However, as usual in candlestick analysis, the trader must take the preceding and following days' prices into account before making any decisions regarding the security.
Bullish engulfing candles indicate immense buying interest that swallows the range of the prior candlestick low and surpasses the candlestick highs. The buying action is frenzied as the candle usually closes at its highs with little to no upper wick. This in turn triggers more buyers who spill over into the next candle. If the next candle closes higher than the bullish engulfing pattern, the next leg of the uptrend usually forms.
Bullish Engulfing Candle Reversals
Where a bullish engulfing candle forms in the context of a trend is one of the most important factors. When a bullish engulfing candle forms at the end of a downtrend, the reversal is much more powerful as it represents a capitulation bottom. The lows of the candle should be the low of the downtrend. This is usually preceded by a minimum of four consecutive lower low candles prior to the bullish engulfing candle, which should close near the candle highs. When the next candle closes above the bullish engulfing candle, it forms a market structure low trigger, which is the high of the proceeding candlestick. When that high is broken, then an official trend reversal forms.
For example, if XYZ is in a downtrend that has shown five consecutive lower candle closes at 25.20, 25, 24.80, 24.70 and 24.60, then it forms a bullish engulfing candle with a low of 24.30 that bounces and closes at 24.80. The next candle has a high of 25 and closes at 24.95. This sets up the market structure low trend reversal trigger if 25 can break, which is the high of the prior candle. In this case, the stock breaks 25 to trigger a surge that spikes the stock up to 25.30 and reverses XYZ back into an uptrend. The bullish engulfing candle reversal is much stronger than a typical hammer type reversal since the body completely engulfs the prior candle indicating a buying frenzy.
What is a 'Bearish Engulfing Pattern'
A bearish engulfing pattern is a chart pattern that consists of a small white candlestick with short shadows or tails followed by a large black candlestick that eclipses or "engulfs" the small white one. As implied by its name, a bearish engulfing pattern may provide an indication of a future bearish trend.
Bearish Engulfing Pattern
BREAKING DOWN 'Bearish Candlestick Engulfing Pattern'
This type of pattern usually accompanies an uptrend in a security, possibly signaling a peak or slowdown in its advancement. However, whenever a trader analyzes any candlestick pattern, it is important for him, before making any decisions, to consider the prices of the days that precede and follow the formation of the pattern.
A bearish engulfing pattern is seen as the end of an upward trend, marked by the primary candle of upward momentum being overtaken, or engulfed, by a larger secondary candle indicating a shift toward a downtrend. This is particularly relevant when the secondary opening price is higher than the primary price. Additionally, the further down the secondary candle goes, beyond the lower edge of the primary candle, the more significant the downward trend indicator.
This information is used in hopes of anticipating a change in market conditions. If a bearish engulfing pattern is present, an investor focused on short-term gains may choose to sell the particular security if he believes prices will continue to fall, allowing him to move his investments toward a security showing growth potential. Long-term investors may not choose to sell the security, as a bearish engulfing pattern is not a guarantee of a long-term downward trend.
Understanding Candlestick Charts
A candlestick is composed of three points: the open, the close and the wick. The open and close points represent the opening and closing prices, respectively, of a particular security. If the open point is below the close point, this notes an upward trend, often shown in white or blue when charted. If the open point is higher than the close, this indicates a downward trend, often shown in black or red when charted. The wicks represent the most extreme price, one for the high and one for the low, paid for a particular security during the period being analyzed.
Bullish Engulfing Pattern
A bullish engulfing pattern is represented by the opposite of a bearish market, with an upward trend overtaking a previous downward trend within a candlestick chart. This may be an indicator a market shift is occurring and an upward trend is on the horizon.
Read more: Bearish Engulfing Pattern http://www.investopedia.com/terms/b/bearishengulfingp.asp#ixzz4niv3z6gV
0 comments:
Post a Comment