Wednesday 28 June 2017

Easy Bollinger Bands Candlestick Pattern explained

Bollinger Bands Candlestick Explained


Bollinger bands are easy to use and can replace trend channels as the indicator shows the range where the price mostly moves. Working with Bollinger bands you can use a signal: when the price sharply breaks the band it tends to return back to the central indicator line.


A procedure after a signal appearance:

1) Add BB indicator to the price chart;

Add an Indicator

ndicator Settings

2) Wait when the price has moved outside the indicator;

3) After the price has returned inside and a confirming candlestick has been closed we can open a deal directed towards the central indicator line;

Buying a call after the lower band breakout

Buying a put after the upper band breakout

The upper and lower Bollinger bands can be used as the levels of support and resistance.

A procedure after a signal appearance:

1) The price is closed at the upper/lower indicator line;

2) A new candlestick moves in reverse direction;

3) Wait for a confirmation and buy an option directed towards a central indicator line.Buying a put after bounce off the upper band – resistance line

Rising and Falling Three Methods Candlestick Pattern

The three methods continuation signal appears during a pause in trend development. On the chart it is formed by some small candlesticks appeared after a big candlestick. A main feature of this formation will be some new small candlesticks within a range of the previous candlestick size. There can be three or more candlesticks. A big candlestick in the trend direction will form the end of the model and give a continuation signal. You should start trading after closing this candlestick.

A procedure after a signal appearance:

1) When small candlesticks appear after a strong candlestick in a tendency direction you should be prepared to open a deal;

2) A big candlestick continuing a tendency appears;

3) After closing this candlestick buy an option in its direction.

Buying a call after bullish 3-method formation

Buying a put after bearish 3-method formation

As you can see on the pictures the 3-method formation reminds such technical analysis patterns as a flag or pennant.


DEFINITION of 'Falling Three Methods'


A bearish candlestick pattern that is used to predict the continuation of the current downtrend. This pattern is formed when the candlesticks meet the following characteristics:

1. The first candle in the pattern is a long red candlestick within a defined downtrend.
2. A series of ascending small-bodied candlesticks that trade within the range of the first candlestick.
3. A long red candlestick creates a new low, which suggests that the sellers are back in control of the direction.

BREAKING DOWN 'Falling Three Methods'

The series of small-bodied candlesticks are regarded as a period of consolidation before the downtrend is able to continue. This pattern is important, because it shows traders that buyers still do not have enough conviction to reverse the trend and it is used by some active traders as a signal to add to their short positions.

Rising Three Methods


A bullish candlestick pattern that is used to predict the continuation of the current uptrend. This pattern is formed when the candlesticks meet the following characteristics:

1. The first candle in the pattern is a long white candlestick within a defined uptrend.
2. A series of descending small-bodied candlesticks that trade within the range of the first candlestick.
3. A long white candlestick creates a new high, which suggests that bullish are back in control of the direction.

BREAKING DOWN 'Rising Three Methods'


The series of small-bodied candlesticks are regarded as a period of consolidation before the uptrend is able to continue. This pattern is important because it shows traders that sellers still do not have enough conviction to reverse the trend and it is used by some active traders as a signal to add to their positions.

Monday 26 June 2017

Tweezers Candlestick Pattern for Trend Traders

Another strong reversal signal is a tweezers candlestick pattern. Tweezers are two candlesticks in reverse direction and having the same maximums or minimums: at descending tendency tweezers candlesticks have the same minimums and at ascending tendency they have the same maximums. Minimums and maximums of the tweezers can be the closing prices or candlestick shades. The candlesticks of formation can appear one by one or have the other candlesticks between them. This is a strong signal that can strengthen or be strengthened by the other candlestick formations.

A procedure after a signal appearance:

1) If you see the candlesticks with the same minimums or maximums on the chart be prepared for a reversal price movement;

2) After closing the candlestick having formed tweezers buy an option in the changed direction.

Buying a call after tweezers formation

Tweezers with bullish engulfing

As the tweezers formation gives a strong signal it is not necessary to wait for a confirmation especially if it forms at the levels of support or resistance. But if you are not sure as for a current market situation you can wait for a new candlestick and see its direction. A signal confirmation mostly helps you to save your profit.

Pin-Bar or squat candlestick Pattern

Squat candlesticks often show a tendency reversal. Usually they tell about uncertainty of a current market direction. The squat candlesticks mostly appear at the price levels. There can be one or some such candlesticks. If you see a candlestick with a small body and long shade you should be prepared for the current tendency reversal.

A procedure after a signal appearance:

1) If you see a squat candlestick has appeared be prepared to open a deal;

2) A squat candlestick is followed by a new reversal candlestick;

3) After closing a new candlestick open a deal in its direction.


Buying a call after a squat candlestick

If you see a tendency continuation after appearance of the squat candlestick you should consider the signal to be canceled. As in a case of engulfing pattern we should wait for closing a new candlestick following the squat candlestick to confirm a reversal.

Remember there can be some squat candlesticks in a raw and all of them will signalize about market uncertainty. You can study many squat candlestick patterns from the books on candlestick analysis.

How to utilize candlestick Engulfing Candlestick Pattern

Engulfing Candlestick Pattern :
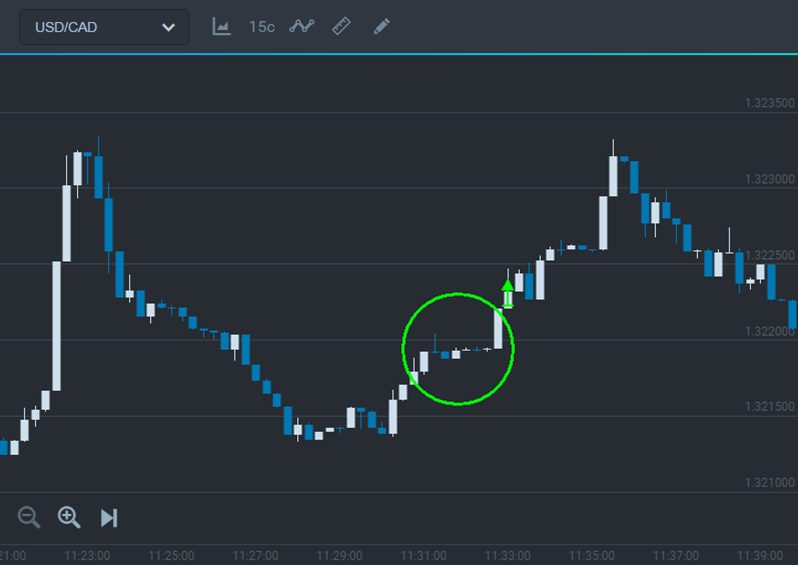
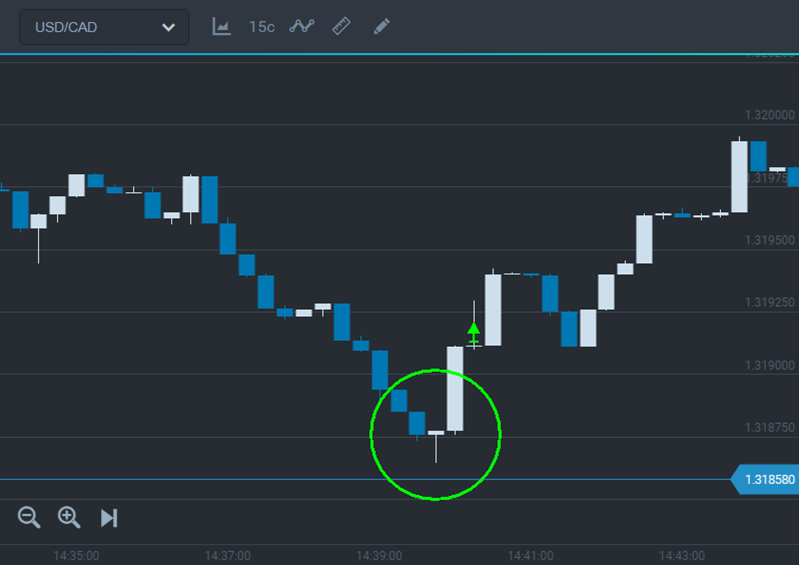
This pattern signalizes about reversal of the price movement. We see this signal after a candlestick has appeared and its body is bigger than the previous reversal candlestick. This is an engulfing candlestick. When this signal appears we should be prepared and see where the next candlestick will move. If the candlestick has the same direction as an engulfing pattern you can open a deal after its closing.

A procedure after a signal appearance:

1) See a bigger candlestick in opposite direction to a previous candlestick;
https://expertoption.com/?refid=15234
2) Wait for appearance of a new candlestick confirming a direction;

3) Open a deal in the engulfing direction after closing a new candlestick.


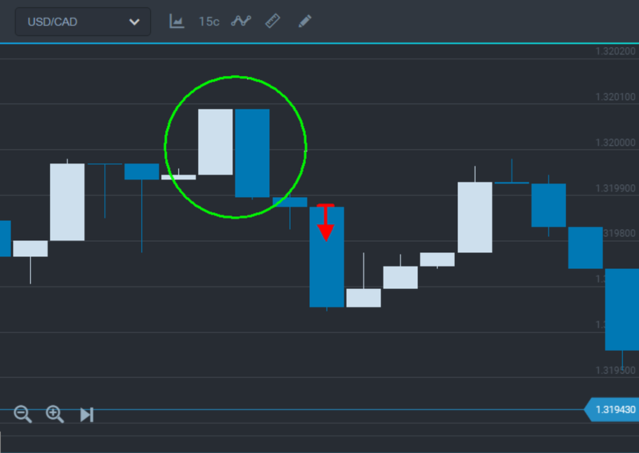
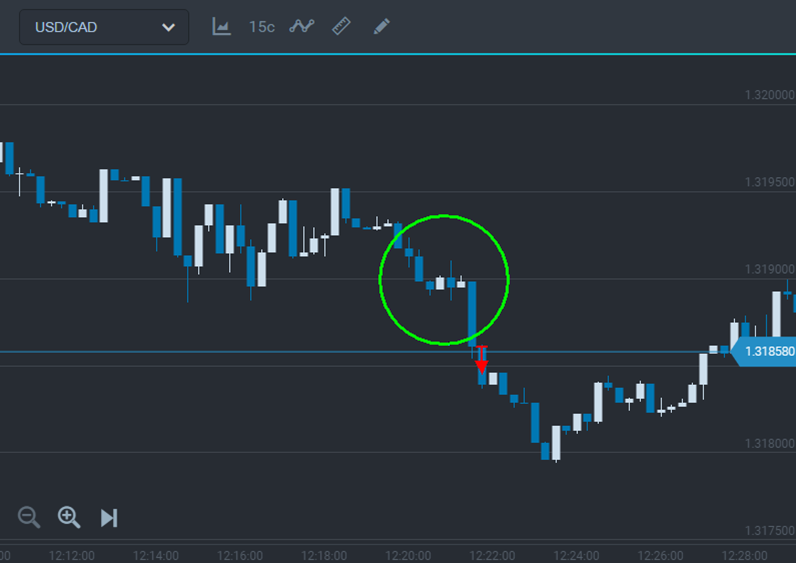
Buying a put after a bearish engulfing pattern

The bigger engulfing candlestick is the stronger price movement will be after reversal. In this case if you have some profit you can risk and buy an option after closing a strong engulfing candlestick. But remember you should always wait for confirmation of candlestick signals.


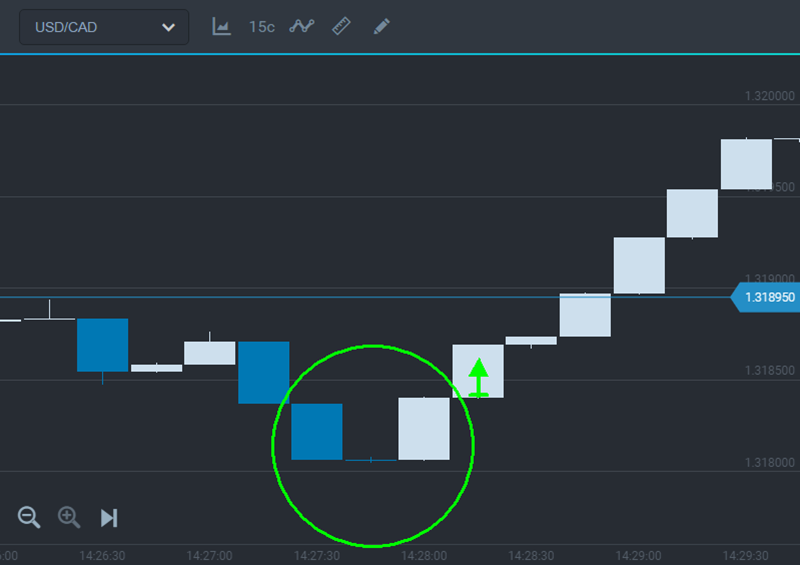
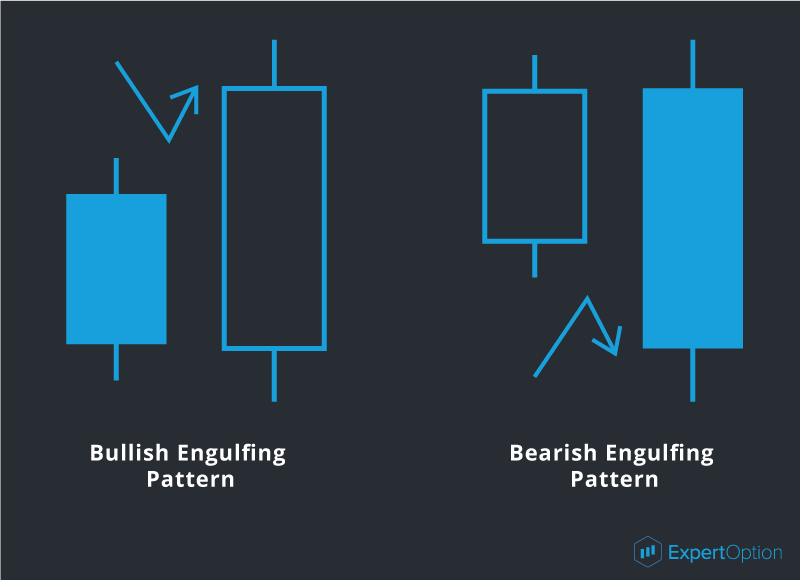
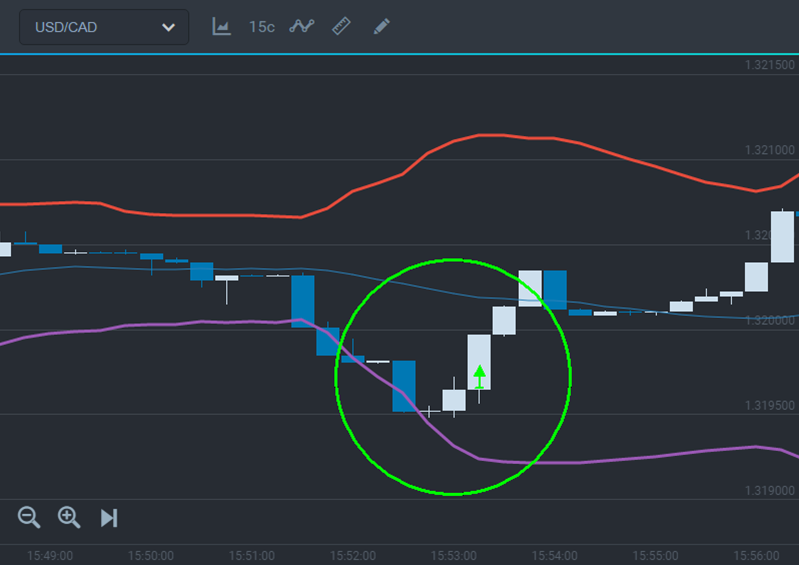
What is a 'Bullish Engulfing Pattern'

A bullish engulfing pattern is a chart pattern that forms when a small black candlestick is followed by a large white candlestick that completely eclipses or "engulfs" the previous day's candlestick. The shadows or tails of the small candlestick are short, which enables the body of the large candlestick to cover the entire candlestick from the previous day.
Bullish Engulfing Pattern
BREAKING DOWN 'Bullish Engulfing candlestick Pattern'
As implied in its name, this trend suggests the bulls have taken control of a security's price movement from the bears. This type of pattern usually accompanies a declining trend in a security, suggesting a low or end to a security's decline has occurred. However, as usual in candlestick analysis, the trader must take the preceding and following days' prices into account before making any decisions regarding the security.

Bullish engulfing candles indicate immense buying interest that swallows the range of the prior candlestick low and surpasses the candlestick highs. The buying action is frenzied as the candle usually closes at its highs with little to no upper wick. This in turn triggers more buyers who spill over into the next candle. If the next candle closes higher than the bullish engulfing pattern, the next leg of the uptrend usually forms.
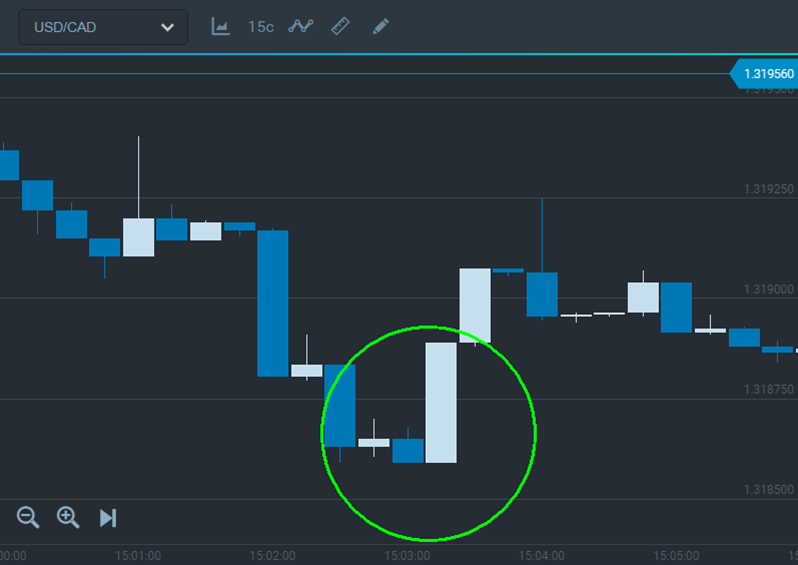
Bullish Engulfing Candle Reversals

Where a bullish engulfing candle forms in the context of a trend is one of the most important factors. When a bullish engulfing candle forms at the end of a downtrend, the reversal is much more powerful as it represents a capitulation bottom. The lows of the candle should be the low of the downtrend. This is usually preceded by a minimum of four consecutive lower low candles prior to the bullish engulfing candle, which should close near the candle highs. When the next candle closes above the bullish engulfing candle, it forms a market structure low trigger, which is the high of the proceeding candlestick. When that high is broken, then an official trend reversal forms.

For example, if XYZ is in a downtrend that has shown five consecutive lower candle closes at 25.20, 25, 24.80, 24.70 and 24.60, then it forms a bullish engulfing candle with a low of 24.30 that bounces and closes at 24.80. The next candle has a high of 25 and closes at 24.95. This sets up the market structure low trend reversal trigger if 25 can break, which is the high of the prior candle. In this case, the stock breaks 25 to trigger a surge that spikes the stock up to 25.30 and reverses XYZ back into an uptrend. The bullish engulfing candle reversal is much stronger than a typical hammer type reversal since the body completely engulfs the prior candle indicating a buying frenzy.

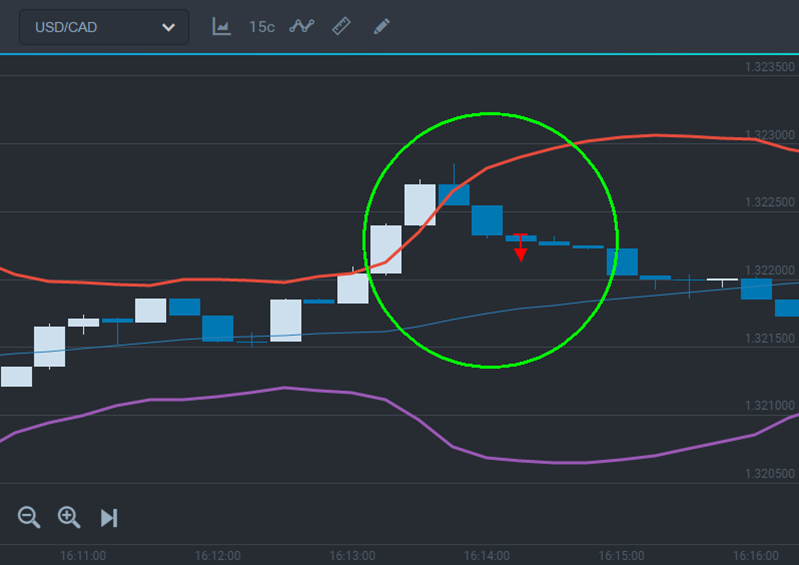
What is a 'Bearish Engulfing Pattern'

A bearish engulfing pattern is a chart pattern that consists of a small white candlestick with short shadows or tails followed by a large black candlestick that eclipses or "engulfs" the small white one. As implied by its name, a bearish engulfing pattern may provide an indication of a future bearish trend.
Bearish Engulfing Pattern
BREAKING DOWN 'Bearish Candlestick Engulfing Pattern'
This type of pattern usually accompanies an uptrend in a security, possibly signaling a peak or slowdown in its advancement. However, whenever a trader analyzes any candlestick pattern, it is important for him, before making any decisions, to consider the prices of the days that precede and follow the formation of the pattern.

A bearish engulfing pattern is seen as the end of an upward trend, marked by the primary candle of upward momentum being overtaken, or engulfed, by a larger secondary candle indicating a shift toward a downtrend. This is particularly relevant when the secondary opening price is higher than the primary price. Additionally, the further down the secondary candle goes, beyond the lower edge of the primary candle, the more significant the downward trend indicator.

This information is used in hopes of anticipating a change in market conditions. If a bearish engulfing pattern is present, an investor focused on short-term gains may choose to sell the particular security if he believes prices will continue to fall, allowing him to move his investments toward a security showing growth potential. Long-term investors may not choose to sell the security, as a bearish engulfing pattern is not a guarantee of a long-term downward trend.
Understanding Candlestick Charts

A candlestick is composed of three points: the open, the close and the wick. The open and close points represent the opening and closing prices, respectively, of a particular security. If the open point is below the close point, this notes an upward trend, often shown in white or blue when charted. If the open point is higher than the close, this indicates a downward trend, often shown in black or red when charted. The wicks represent the most extreme price, one for the high and one for the low, paid for a particular security during the period being analyzed.
Bullish Engulfing Pattern

A bullish engulfing pattern is represented by the opposite of a bearish market, with an upward trend overtaking a previous downward trend within a candlestick chart. This may be an indicator a market shift is occurring and an upward trend is on the horizon.

Read more: Bearish Engulfing Pattern http://www.investopedia.com/terms/b/bearishengulfingp.asp#ixzz4niv3z6gV
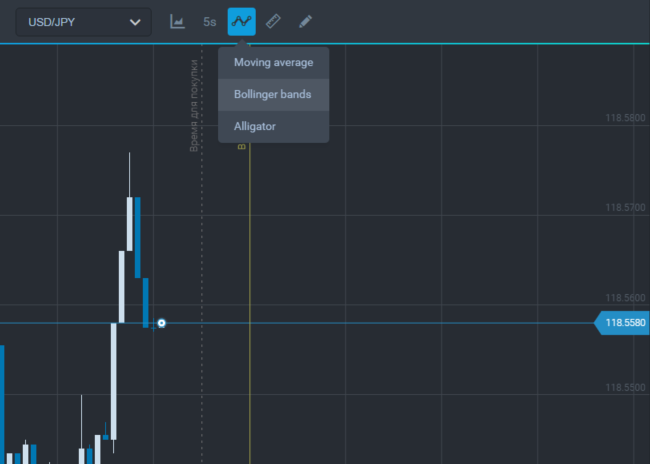
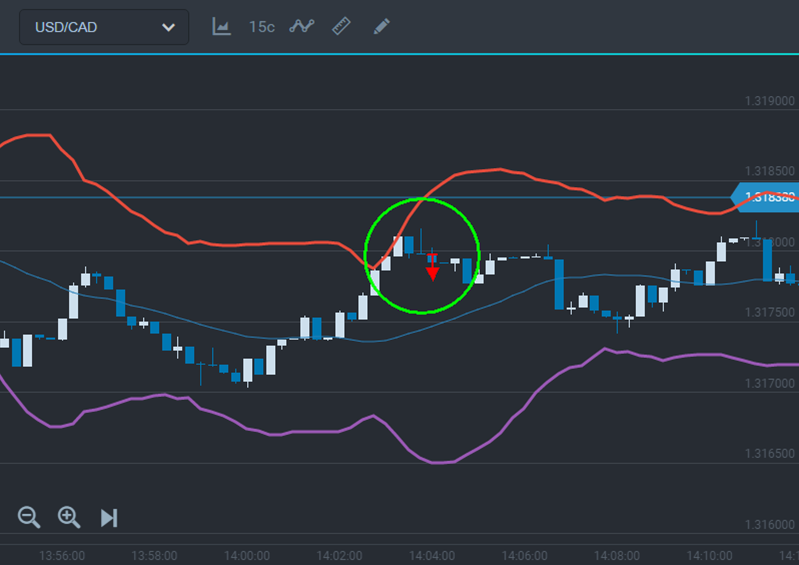
Sunday 25 June 2017

Rebound from Line Pattern in IQOPTION explained

Rebound from Line Pattern in IQOPTION
A  simple pattern to assume the upcoming trend for a successful trading in iqoption.
The main aspect of this pattern is that we open a deal after a price movement reversal. A trading signal will be a candlestick having reached the level and failed to be closed outside it. A candlestick can touch the level by its shade or body. Breaking a strength level by a candlestick shade and closing inside the level shows that the price is not able to break out it. A signal confirmation will be a new candlestick following it and moving in a reverse direction.

A procedure after a signal appearance:

1) A candlestick was not able to be closed outside the level and touched it by its shade or body;

2) Wait for a confirmation – when the second candlestick bounces off the level;

3) Buy an option in the reverse direction.

Buying a put if the price bounces off a resistance level

Buying a call if the price bounces off a support level

Buying a call if the price bounces off an ascending trend line

Sell if the price bounces off an ascending channel line

Remember you can find many support and resistance levels on the chart but only the levels confirmed by the price will affect the price in future. To check a strength level is easy enough: you should review the price history and see how often the price stopped or reversed at this level. If the price “has not noticed” the level no need to consider it in your analysis.


Rebound from Line PatternRebound from Line Pattern

Breaking of Minimum and Maximum in Iqoption

This is a process in which in which we will find the minimum and maximum point of the current market scenario using Graphical tools like lines and Technical Tools like Moving Averages.this is also known as local level Breaking pattern.

According to this strategy you open a deal when the price breaks out the current level and continues its movement in the same direction. A deal should be opened after a candlestick body breaks out the level of support or resistance and a new candlestick moves in the same direction.


A procedure after a signal appearance:

1) The price chart has reached a support or resistance level;

2) Wait for appearance of the candlestick breaking out the level with its body and closing there;

3) Wait for appearance of a new candlestick moving in the breakout direction;

4) Buy an option in the breakout direction after closing a confirming candlestick.


Buying a put after breakout of the support level


Buying a put after breakout of the descending trend channel


Buying a call after breakout of the descending trend line

Using a breakout strategy you should always have a signal confirmation as breakout can be false. A false breakout of the level appears when the first candlestick breaks the level and the second candlestick returns back to opening price of the first candlestick.


Aspects of the false breakout:

1) A candlestick has broken the level with its shade and closed inside the level;

2) A candlestick has been closed at the level or a bit outside and a new candlestick returned to the range inside the level.


False breakout of the support level

If after breakout a reversal or squat candlestick has appeared this breakout can be false. In this case you should wait for a candlestick moving in the breakout direction and buy an option after its closing.


What is Binary options?


What is a 'Binary Option'


A binary option, or asset-or-nothing option, is type of option in which the payoff is structured to be either a fixed amount of compensation if the option expires in the money, or nothing at all if the option expires out of the money. The success of a binary option is thus based on a yes or no proposition, hence “binary”. A binary option automatically exercises, meaning the option holder does not have the choice to buy or sell the underlying asset.

BREAKING DOWN 'Binary Option'


Investors may find binary options attractive because of their apparent simplicity, especially since the investor must essentially only guess whether something specific will or will not happen. For example, a binary option may be as simple as whether the share price of ABC Company will be above $25 on November 22nd at 10:45 am. If ABC’s share price is $27 at the appointed time, the option automatically exercises and the option holder gets a preset amount of cash.
What is a 'Binary Option'
A binary option, or asset-or-nothing option, is type of option in which the payoff is structured to be either a fixed amount of compensation if the option expires in the money, or nothing at all if the option expires out of the money. The success of a binary option is thus based on a yes or no proposition, hence “binary”. A binary option automatically exercises, meaning the option holder does not have the choice to buy or sell the underlying asset.

BREAKING DOWN 'Binary Option'
Investors may find binary options attractive because of their apparent simplicity, especially since the investor must essentially only guess whether something specific will or will not happen. For example, a binary option may be as simple as whether the share price of ABC Company will be above $25 on November 22nd at 10:45 am. If ABC’s share price is $27 at the appointed time, the option automatically exercises and the option holder gets a preset amount of cash.
Difference Between Binary and Plain Vanilla Options
Binary options are significantly different from vanilla options. Plain vanilla options are a normal type of option that does not include any special features. A plain vanilla option gives the holder the right to buy or sell an underlying asset at a specified price on the expiration date, which is also known as a plain vanilla European option. While a binary option has special features and conditions, as stated previously.

Binary options are occasionally traded on platforms regulated by the Securities and Exchange Commission (SEC) and other regulatory agencies, but are most likely traded over the Internet on platforms existing outside of regulations. Because these platforms operate outside of regulations, investors are at greater risk of fraud. Conversely, vanilla options are typically regulated and traded on major exchanges.

For example, a binary options trading platform may require the investor to deposit a sum of money to purchase the option. If the option expires out-of-the-money, meaning the investor chose the wrong proposition, the trading platform may take the entire sum of deposited money with no refund provided.

Binary Option Real World Example
Assume the futures contracts on the Standard & Poor's 500 Index (S&P 500) is trading at 2,050.50. An investor is bullish and feels that the economic data being released at 8:30 am will push the futures contracts above 2,060 by the close of the current trading day. The binary call options on the S&P 500 Index futures contracts stipulate that the investor would receive $100 if the futures close above 2,060, but nothing if it closes below. The investor purchases one binary call option for $50. Therefore, if the futures close above 2,060, the investor would have a profit of $50, or $100 - $50


Difference Between Binary and Plain Vanilla Options


Binary options are significantly different from vanilla options. Plain vanilla options are a normal type of option that does not include any special features. A plain vanilla option gives the holder the right to buy or sell an underlying asset at a specified price on the expiration date, which is also known as a plain vanilla European option. While a binary option has special features and conditions, as stated previously.

Binary options are occasionally traded on platforms regulated by the Securities and Exchange Commission (SEC) and other regulatory agencies, but are most likely traded over the Internet on platforms existing outside of regulations. Because these platforms operate outside of regulations, investors are at greater risk of fraud. Conversely, vanilla options are typically regulated and traded on major exchanges.

For example, a binary options trading platform may require the investor to deposit a sum of money to purchase the option. If the option expires out-of-the-money, meaning the investor chose the wrong proposition, the trading platform may take the entire sum of deposited money with no refund provided.

Binary Option Real World Example


Assume the futures contracts on the Standard & Poor's 500 Index (S&P 500) is trading at 2,050.50. An investor is bullish and feels that the economic data being released at 8:30 am will push the futures contracts above 2,060 by the close of the current trading day. The binary call options on the S&P 500 Index futures contracts stipulate that the investor would receive $100 if the futures close above 2,060, but nothing if it closes below. The investor purchases one binary call option for $50. Therefore, if the futures close above 2,060, the investor would have a profit of $50, or $100 - $50

Read more: Binary Option http://www.investopedia.com/terms/b/binary-option.asp#ixzz4l344QpUw

IQOPTION REVIEW : LEGIT OR SCAM


IQ Option Review


IQ Option Review

IQ Option is a licensed and regulated binary options broker, owned and operation by Iqoption Europe ltd.. They are located at Yiannis Nicolaides Business Center, Agiou Athanasiou Avenue 33, 4102, Agios Athanasios, Limassol, Cyprus.

Their phone number is +44 20 8068 0760. Their email address is: support@iqoption.com.

IQ Option Platform Review


IQ Option is a unique broker using their own custom built binary options trading platform. The platform offers speed trading in increments up to 5 minutes. Their binary options go out 1 hour in 15 minute increments, and they have expiry times as far out as one month. They have more than 500 underlying assets available for trading, with the only commodity they offer being Gold. IQ has mobile trading apps available for both Android and iOS.

A popular feature at IQOption are their weekly trading competitions. Their minimum deposit is only $10, and they offer a free demo account.


*General Risk Warning: The financial services products offered by the company provided by this website carry a high level of risk and can result in the loss of all your funds. You should never invest money that you cannot afford to lose.


Editor’s Note – Why IQ Option Doesn’t Suck in 50 Words


Finally, after what seems like ages, I find a brokerage that doesn’t look like a carbon copy of every other broker on the market. IQ Option is trying to do something different starting with the website layout, the education and of course the innovative, highly functional, trading platform. They also offer a free Demo and I mean really free, without any of the shenanigans like “Deposit 100 bucks in a real account and we will give you a free demo”. I opened the Demo in about 15 seconds.


Why Does IQ Option Suck in 50 Words


I am sorry to say but their expiration times are too limited and I believe this is one of the main issues I have with this broker. Expiry is pretty dynamic, but all purchased options expire by the end of the day at most, so long term traders will feel left out. However, that being said, this is one of the better platforms for short term intra-day traders. Other reasons it may suck is a relatively short asset list and the fact they only have call/put (high/low) style options.


Should I Open an Account with IQ Option?


Right from the start I can see I am not dealing with the usual Binary Options website that shows me a glamorous girl, a limousine or stacks of money. The first thing you will notice is that the home page is free of cheap marketing tactics and instead show me 3D chart which moves continuously. To be honest that makes me feel like I’ve accessed a trading venue, not an online casino like a lot of the other brokers on the market.

IQ Option entered the marketplace in 2013 and since then they’ve done a great job at differentiating themselves from other brokers. First of all, their platform is proprietary, you won’t find it anywhere else. The biggest advantage is the charts, where Japanese candlestick charts and a a list of many technical indicators like Moving Averages, Bollinger Bands, MACD, RSI, Stochastic an 7 others can be used. This is a big thumbs up because as we know, usually binary options brokers severely suck when it comes to charting and additional technical tools.


IQ Option Withdrawal


There is no minimum withdrawal amount but the minimum deposit is $10. A transaction will be processed in 24 hours. The money must go to the same source they originated in order to prevent money laundering. Also, before being able to withdraw, clients have to provide identification documents, which is another practice required by anti-money-laundering rules. Further, withdrawals can be made by just about any eWallet on the internet which gives the fastest payouts, within hours of processing unlike CC or wires which could take another 7-10 days.


IQ Option Extras


Candlestick charts are considered an extra for binary options brokers even in this day and age. It makes me almost sad to say it, but it’s a fact so they get bonus points for it. Their innovative platform can also be considered an extra feature as are the many tournaments for trading that they offer.


IQ Option Ratings


User Friendly 18/20

The website is available in thirteen languages and that is above average but the platform can be a bit hard to get used to, especially for a new trader; however, I don’t think this will be a big problem because it’s pretty intuitive. Everything else on the website is well structured and easy to find. US traders are not accepted. Check the terms and conditions for the full list of countries that are not accepted such as: Australia, Canada and Belgium.


Number of assets and expiry times 15/20

They offer up to 500 assets to trade. The expiry times are limited to “Turbo options” (60 sec, 120 sec) and short term (3 min, 5 min, 15 min, 30 min, hourly) with the longest being end of month.


Commissions, Support and Effective return 17/20

There are no commissions to use this broker, standard for the industry. There is however a dormant account fee after being inactive for 90 days in a row but the it’s only an annual fee of 50€ but it won’t be higher than your account balance. Support is little iffy, there’s no Live chat, only phone or email which isn’t a problem once you open an account. The effective return for successful trade goes up to 91% which is one of the highest in the industry, and they also have a OTM refund that can be pretty substantial for VIP traders.


Deposit, Payment and Bonus 18/20

The minimum deposit is $10 for a Real account. Deposits can be made via credit cards, wire transfers and e-wallets including WebMoney, Skrill and Neteller. Withdrawals can be made through the same methods. Bonus is not longer available due to CySEC new regulations. Withdrawals are processed within 24 hours.


Extras 15/20

As I mentioned before, their platform is an extra on its own because it is unique. Just a basic form of technical analysis can be conducted but it’s still much better than what others have to offer and there are 12 of the most popular indicators to use as well. The tournaments are another nice extra as they allow for lots of extra income, for the best traders of course. Lacking some features most major platforms includes.