Saturday, 22 July 2017

3 Ways to Keep Your Confidence During Trading Slump

Thinking about Keeping up your confidence during trading , we will help you do it.
Slumps are inevitable in trading. They come with the market’s ever-changing environment, and even successful traders go through them.so how to keepup confidence during trading ?

I once heard a story about a trader who went through 48 months in a row without having a single negative month. On average, he made about $2,000 a day during this period. And then all of a sudden his streak came to an end and he went through a long slump wherein he couldn’t string together two profitable months in a row.

In such stressful times, it’s very easy to beat yourself up, focus on what you’re doing wrong, and overlook the things you’ve been doing right. It’s part of human nature!
[caption width="300" align="alignnone"]Confidence During Trading Confidence During Trading[/caption]
It can be argued that being hard on yourself is a way of addressing your problems. But it can become more of a bane than a boon to your trading if you get caught up in all the pessimism.

When the mind is zoned in on all the negative aspects of your trading, there’s a tendency to lose sight of the positive aspects that brought you success in the past.

It’s for this reason that I believe it’s better to focus your attention on banking on your strengths in times when you’re in a slump. Go back to the basics, as they say!

On the flipside, when you’re trading well, your attention should be shifted to the improvements that you can still make.

Doing so will help keep your trading confidence at proper levels. Remember, having low confidence can be just as bad for you as being overconfident!

Here are some steps you can take to stay positive during a trading slump:
1. Don’t simply dwell on the problem. Act on it.

As I mentioned in one of my articles about correcting bad trading habits, you should try to be more conscious of your trade decisions.

You can do this by talking out loud while trading or by journaling your trade decisions. Taking note of your thoughts and feelings during a trade can help you identify what you’re doing wrong so that you can work on cutting those bad habits later on.
2. Review those trades that worked well for you.

Having a detailed trading journal should come in handy at this point so I sure hope you have one!

By keeping track of the proper trade decisions you’ve made and the profitable setups you’ve taken, you’ll be able to identify which ones are effective for you. Also, reminding yourself that you were able to catch some good moves in the past would serve as a nice boost for your ego.
3. Find your trading niche.

Niche trading is all about specializing and focusing on what works well for you. You see, some traders aren’t able to perform well because there’s a mismatch between their personalities and their trading styles.

To avoid this, ask yourself the following questions:

What am I good at?
What are my strengths and weaknesses as a trader?
What are the qualities that can make me successful?

You might also want to take our Personality Quizzes in the School of Pipsology to help you find the answers to questions such as the following: Which currency pair should I trade? Which trading style is best for me? What kind of mechanical system suits my personality?

Bear in mind that one of the biggest challenges in trading is to stay focused and positive, even when your account balance is turning negative.

By making sure that your confidence remains intact, you’ll have a better chance of making it out of a slump. Remember to focus on the process and not solely on the profits.

Are You Forcing Your Forex Trades? you should avaoid it now

How can you stop forcing your forex trades
At some point during your trading experience, you might have felt like the market is out to get you and that absolutely nothing is going your way.

In these situations, do you a.) take a step back to regain focus or b.) try harder and prove that you can catch pips no matter what?
forcing your forex trades
If the latter applies to you more often than not, then you might be prone to forcing your trades.

Forcing trades usually means taking trades that don’t meet your trading rules, though it could also mean taking positions that are too large or trading too often for your comfort levels.

These trading no-no’s often take place when one is bent on making things happen instead of simply reacting to what is happening.

Remember that some characteristics of a successful trader, such as being competitive and aggressive, can also be potential pitfalls.

A highly competitive trader, for example, might have trouble staying calm and collected while in the middle of a nasty losing streak, and eventually resort to overtrading, revenge trading, or over-leveraging just to make his or her money back.

So, how do you avoid the temptation of forcing your trades? The answer, according to my favorite trading psychologist Dr. Brett Steenbarger, is to turn your rules into habits.

Like in any habit formation, the hardest part is at the beginning.

For forex traders, this is the part where you force yourself to follow your tried-and-tested rules on position sizing, leveraging, stop loss placements, and risk management. Write down your rules and follow a check list if it helps.

The process gets easier as you develop a rhythm and see the (hopefully positive) results of strictly sticking to your plans.

When you trust your own system and you don’t want to fix something that ain’t broke, then you’ll be less tempted to force your trades the next time you feel the urge to do it.

If you haven’t found a set of trading rules that would keep you away from forced trades, then all you need to do is remember that profitable traders stay ahead of the rest of the pack because they make decisions based on probabilities and not on emotions.

Consistently profitable traders recognize that trading is a dance where the market ALWAYS takes the lead.

If you attempt to lead the market by anticipating future price action, or find beats (read: opportunities) where there aren’t any, then you could fall flat on your face and miss out on the more profitable moves.

Remember that trading is a marathon and not a sprint. The goal is to trade for another day until you learn how to be consistently profitable with your strategies. Don’t sabotage your progress by forcing your trades.

When It’s Okay to Take a Break From Forex Trading

you needa break from forex trading ?
You’re like a deer in the headlight staring at your screens, feeling overwhelmed by all the new information and forex market movements.

You feel the pressure to perform. You haven’t made a winning trade all week.

The bills are due and your checking account is running low. You don’t know what you’re going to do. You’re becoming desperate and you swear to yourself “I’m going to push myself to make some pips.”

forex vacationUnfortunately, the more you tell yourself this, the more stressed and more upset you become. It’s time to chill, dude! Or do as Big Pippin does: put on some music, grab a glass of wine, and take a bubble bath.

In these situations, it’s natural to feel that you must push yourself to the limits to make a profit. Depending on your abilities and resources, be careful that you don’t push yourself too hard. You might make matters worse.

Forex trading is a profession where you can convince yourself that your work is never done. There’s always another chart to read, an economic report to digest, or a new trading strategy to create or test.

When it’s been some time since you’ve made a winning trade, you start to feel that you absolutely positively must make a profit. And with the forex market open 24 hours a day, you feel like there’s absolutely no excuse to miss out on any profit opportunities.

But unless you are a seasoned forex trading veteran, pushing yourself to the limits will only add to your frustration. Suddenly, you can’t seem to get anything done. Applying additional stress on yourself doesn’t always increase performance levels. Stress and performance work according to what scientists call an “inverted U curve”.

Here’s how the inverted U-curve works in a nutshell. When a task is easy, like running around the block, a high level of stress enhances performance, but when a task is difficult and intellectually challenging, such as devising a profitable trading strategy, a high level of stress impedes performance.

Stress, even a small amount, saps up limited psychological energy. When you put stress on yourself to trade more profitably, you’ll find that you start to feel a little tired. And if you push yourself too far, and go way beyond your abilities, you’ll eventually exhaust all your stored psychological energy. And die. Okay, I’m just kidding. Maybe.break from forex

When you feel stressed out because you are putting pressure on yourself, try reducing some of the pressure.

Tell yourself, “I’m not going to keep pushing myself. I’m just going to come up with a modest goal and work at it one minute at a time, and then maybe, one hour at time. I’ll just give it my best effort.”

See what happens when you try this thinking strategy. You’ll find that you’ll harness a little more energy just by simply taking some of the pressure off. Taking a break in the middle of a stressful day can also do wonders. Step outside, take a walk and soak up the sunshine. It will release some pent up stressful and negative energy.

You can also try a simple form of meditation. Go to a quiet place, and simply repeat this mantra, “I accept what I can get out of the market.”

Repeat it over and over again. Concentrate on the words and let your worries about the markets disappear from your consciousness. You’ll feel a little better, and you’ll feel your energy level rise.

If you are a seasoned trader, pushing yourself to reach higher and higher standards of excellence can produce higher levels of performance. But if you are a novice trader, pushing yourself beyond your limits usually leads to frustration, stress, and eventual exhaustion.

When you have pushed yourself so far that you feel the pressure, STOP! Take a chill pill. Accept your limitations and relax. Ironically, you’ll feel a little energy boost and will suddenly feel empowered. At that point, you’ll be ready to tackle the forex market again, and grab those positive pips.

Dollar falls on perceived ECB path, U.S. political roadblocks
Dollar Falls


(Updates prices, adds comments; changes byline, dateline, pvs LONDON)

* ECB policy meeting seen as supportive for single currency

* Investigations into Russian meddling in U.S. election hurt dollar

* Dollar index touches more than 1-year low

By Sam Forgione
[caption width="800" align="alignnone"]dollar falls finally © Reuters. FOREX-Dollar falls on perceived ECB path, U.S. political roadblocks
[/caption]

NEW YORK, July 21 (Reuters) - The U.S. dollar hit its lowest level in more than a year against a basket of major rivals on Friday a day after the European Central Bank's chief abstained from talking down the euro, while obstacles to U.S. President Donald Trump's policy agenda also weighed.

ECB President Mario Draghi said on Thursday that financing conditions remained broadly supportive, and noted that the euro's appreciation had "received some attention." However, he did not cite that strength as a problem nor did he directly try to talk the currency down. apparent lack of concern about the strengthening euro convinced traders that the central bank remained on track to potentially begin tapering its bond-buying stimulus later this year.

The dollar index touched 93.952 .DXY , its lowest level since June of last year, and was last down 0.3 percent at 94.032. The euro touched $1.1677 EUR= , its highest level against the dollar in nearly two years, and was last up 0.2 percent on the day at $1.1653.

"The fact that Draghi didn't necessarily argue too much against the strength of the euro ... certainly gave the greenlight for individuals to want to own the currency again or actually add to their positions," said Dean Popplewell, chief currency strategist at Oanda in Toronto.

The dollar touched a more than four-week low against the yen of 111.09 yen JPY= .

In addition to traders' expectations that the ECB was staying the course toward tightening monetary policy, investigations into alleged Russian meddling in the U.S. election and possible collusion with Trump's campaign were viewed as obstacles to the administration's pro-growth agenda and negative for the dollar.

"Compounding the (weaker dollar) move is this latest news on the political front in the U.S. about the Russia investigation expanding to Trump's business affairs," said Alvise Marino, FX strategist at Credit Suisse (SIX:CSGN) in New York.

"This is on top of the fact that Senate has not been able to pass anything meaningful on the healthcare front," he said in reference to the collapse late on Monday of a Republican effort to overhaul the U.S. healthcare system.

The dollar also touched its lowest against the Swiss franc in more than a year at 0.9468 franc CHF= . The euro was last on track to gain 1.6 percent for the week, which would mark its second straight weekly rise against the dollar
Source: http://www.reuters.com/article/global-forex-idUSL1N1KC0Q7

Friday, 21 July 2017

Easy Iqoption Tips and Tricks For Binary Options Traders

Iqoption & Binary Options Strategy
iqoption and binary options tips and tricks
Welcome to the part of our website dedicated solely to your education! No matter how experienced in trading binary options you might be, you will always be able to find useful tips and advice here to help you improve your chances. We want to help you find a way to create a perfect binary options strategy! Without any restrictions, you can browse dozens of educational articles divided into three categories because we here Tradfox.com always put our readers first. There is something for absolutely everyone here! Of course, new articles will be added on regular basis, so be sure to check this part of the website regularly if you want to expand your knowledge. But for now, allow us to show you what we offer.

Iqoptions & BINARY OPTIONS FOR BEGINNERS

If you’re new in this business, this is the category you should check out first. Here we analyze and explain the most basic terms and show you what to look out for at the beginning of your trading career. We will also show you how use all the most important tools, so that you can immerse yourself in trading without too much stress. In short, this is the category where we provide you with some extremely solid foundations upon which you can then start building your binary options strategy. Go through these articles and you will surely be able to achieve some success on the market. However, do remember that there is much more to learn about binary options, so you definitely shouldn’t stop with your education once you’re done with this category.

ADVANCED Iqoption BINARY OPTIONS

So, you’ve familiarized yourself with the basics? You don’t consider yourself to be a beginner anymore? Good, because there is much more to learn. This is the category where we start to show you just how complex this type of trading can get. We will show you the basic principles behind some of the more demanding tools and an advanced way to come up with your binary options strategy, so that you can scratch below the surface of the market and start thinking several steps ahead. These articles will broaden the range of solutions you have when you take a look at the latest market data. Of course, we still keep things nice and simple, thanks to our experts who know exactly which questions traders have when they reach this stage.

Iqoption and BINARY OPTIONS FOR EXPERTS

Want to become a pro and turn trading binary options from a side income to your main source of income? Great, these are the things you need to master. Go over them even if you consider yourself a trading expert because there are many details you need to be aware of at this level. Even the best traders can discover something new they are not familiar with, or they simply need to learn more about a particular subject. It all pretty much revolves around technical analysis at this stage, so we will give you more options to extract information from the way the market behaved in the past. This is where you get to see just how complex a binary options strategy can get, but don’t let that scare you – our experts will be with you every step of the way.


iqoption and Binary Options Strategy

Welcome to the part of our website dedicated solely to your education! No matter how experienced in trading binary options you might be, you will always be able to find useful tips and advice here to help you improve your chances. We want to help you find a way to create a perfect binary options strategy! Without any restrictions, you can browse dozens of educational articles divided into three categories because we here at BinaryOptionsTrading-Review.com always put our readers first. There is something for absolutely everyone here! Of course, new articles will be added on regular basis, so be sure to check this part of the website regularly if you want to expand your knowledge. But for now, allow us to show you what we offer.
BINARY OPTIONS FOR BEGINNERS

If you’re new in this business, this is the category you should check out first. Here we analyze and explain the most basic terms and show you what to look out for at the beginning of your trading career. We will also show you how use all the most important tools, so that you can immerse yourself in trading without too much stress. In short, this is the category where we provide you with some extremely solid foundations upon which you can then start building your binary options strategy. Go through these articles and you will surely be able to achieve some success on the market. However, do remember that there is much more to learn about binary options, so you definitely shouldn’t stop with your education once you’re done with this category.

So, you’ve familiarized yourself with the basics? You don’t consider yourself to be a beginner anymore? Good, because there is much more to learn. This is the category where we start to show you just how complex this type of trading can get. We will show you the basic principles behind some of the more demanding tools and an advanced way to come up with your binary options strategy, so that you can scratch below the surface of the market and start thinking several steps ahead. These articles will broaden the range of solutions you have when you take a look at the latest market data. Of course, we still keep things nice and simple, thanks to our experts who know exactly which questions traders have when they reach this stage.

Pro Iqoption and Binary Options Trading


Want to become a pro and turn trading iqoption and binary options from a side income to your main source of income? Great, these are the things you need to master. Go over them even if you consider yourself a trading expert because there are many details you need to be aware of at this level. Even the best traders can discover something new they are not familiar with, or they simply need to learn more about a particular subject. It all pretty much revolves around technical analysis at this stage, so we will give you more options to extract information from the way the market behaved in the past. This is where you get to see just how complex a iqoption and binary options strategy can get, but don’t let that scare you – our experts will be with you every step of the way.

All of these articles have been written by our team of reliable iqoption and binary options experts. These people have been a part of this industry since its inception, but they also have significant experience with other types of trading. They know how exciting and profitable iqoption and binary options trading can be, and they also know about the dangers that lurk out there. That’s why they are the best source of information for you and why they started writing these articles in the first place. Our experts are here to help you enjoy your trading and to help you gradually get better at it. With decades of experience between them in total, you can rest assured that you will be provided with only high-quality information. With their help, your binary options strategy will be rock-solid.

Sunday, 2 July 2017

Step by Step Trend, support and resistance lines (updated)

Trend, support and resistance lines
Let's Begin with Trends : Your Best friend.
As we already know, technical analysis studies price charts in order to forecast future direction of prices. How does it work and what can this chart tell us? Let’s clarify this.

Let’s start with the first axiom of technical analysis – price moves in trends. The axiom meaning can be explained by the fact that price movements always have direction and continuing nature. The price may seem to move chaotically upward or downward in the chart. However, price movements have its direction, which is called trend.


Trend is a directional price movement with certain duration.

Looking at the picture above we can notice that despite price moves upward and downward the general direction of all movements is upward. Now let’s get a clear view of the types of trends. They fall into three types depending on direction and duration:


1. Duration:

a. Short-term trend lasts from several minutes to 2 weeks.

b. Intermediate trend may last from 2 weeks to half a year (6 months).

c. Long-term trend is a long-lasting price movement in one direction within several months or even years (from 6 months).

2. Direction:

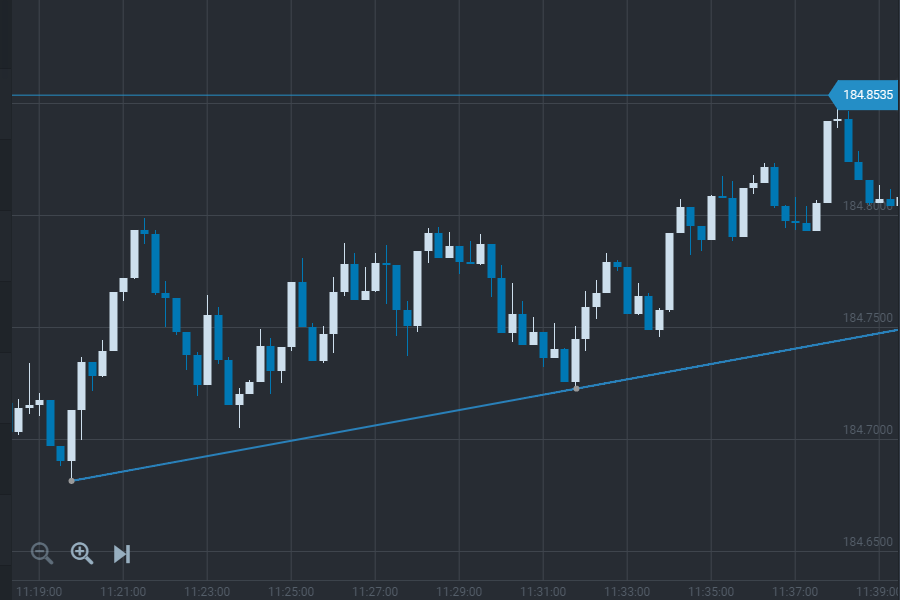
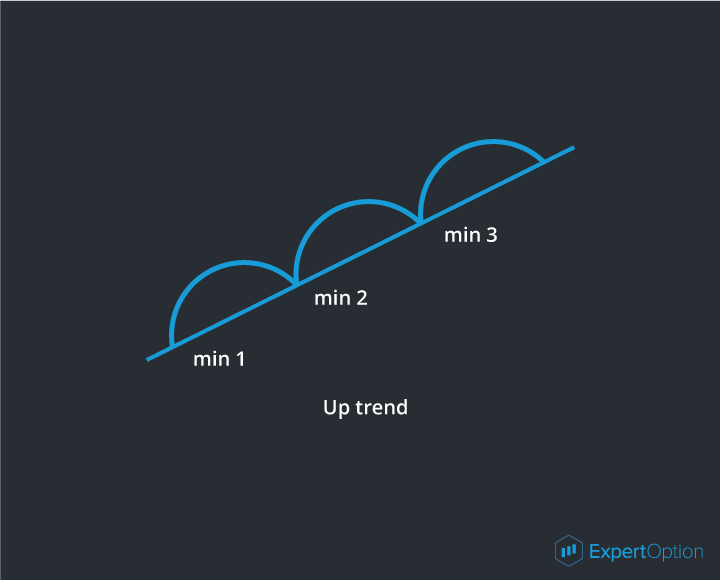
a. Uptrend (bullish trend) is a price movement in which each next minimum is higher than previous one.

Up trend


A trend line can be defined as a line, which connects the minimums of uptrend.


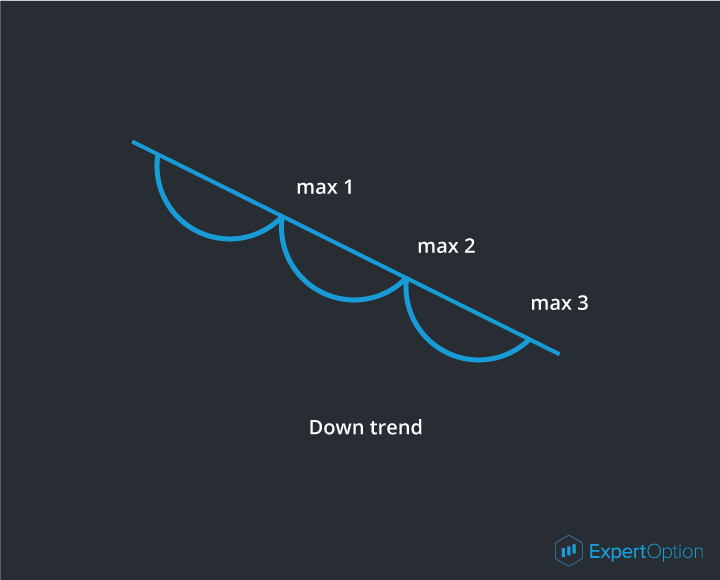
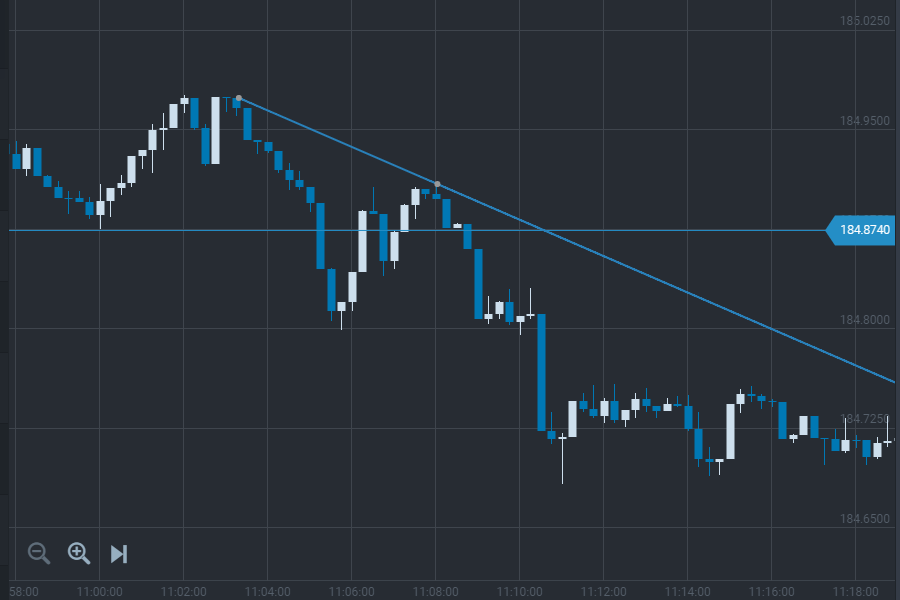
b. Downtrend (bear trend) is a price movement in which each next maximum is lower than previous one.

Downtrend


A down trend line can be defined as a line, which connects the maximums of trend.


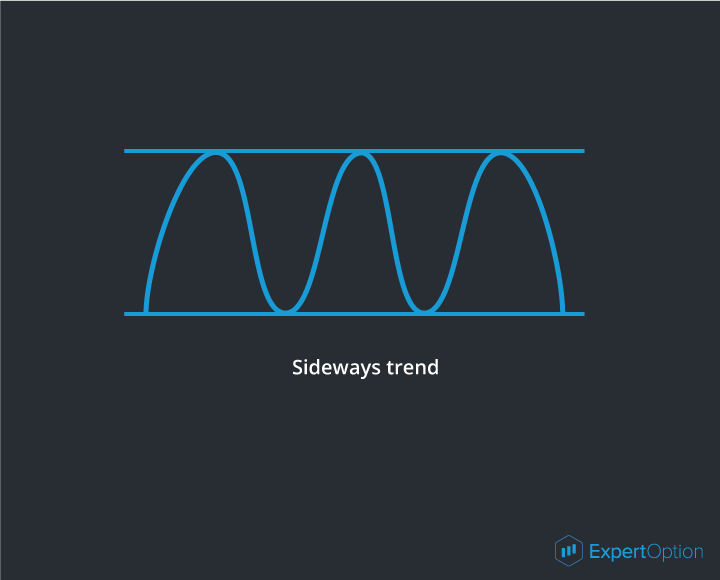
c. Sideways trend (flat) describes price movements without clear direction.

Sideways trend


Binary option trading is generally based on trends with the shortest duration or short-term trends. Therefore, there is no sense in searching for the trends lasting more than 30 minutes for short-term instruments in the form of binary options. It is due to the fact, that trading within one hour time frame is based on short tendencies which are not influenced by other continuing trends of longer time frames. It would be enough if you could define current tendency within 30 minute time frame and use it.

Thus, as you might have already known, a trend line is a line defining the direction of a trend. You will need two points to build a trend line – the closest minimums of ascendant tendency and the closest maximums of descendant tendency.


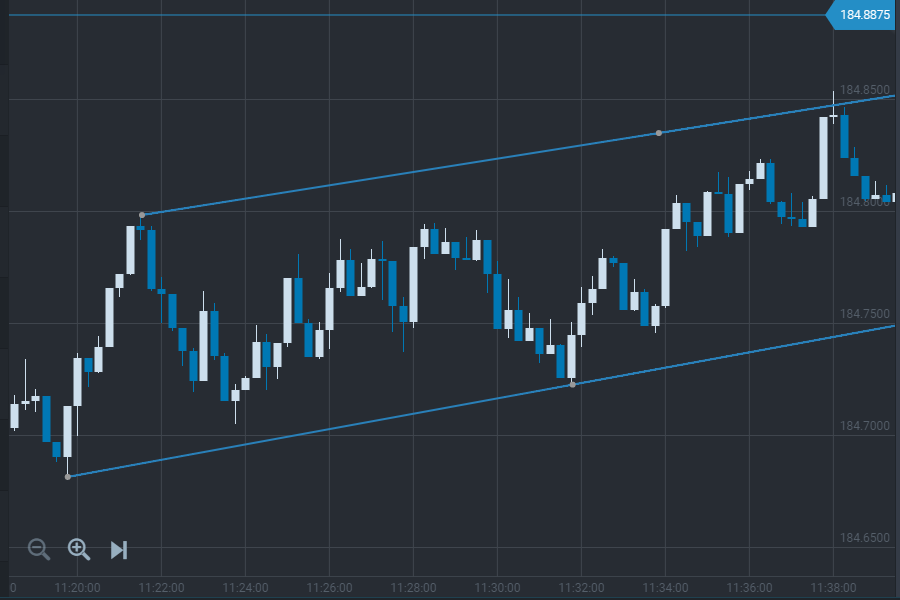
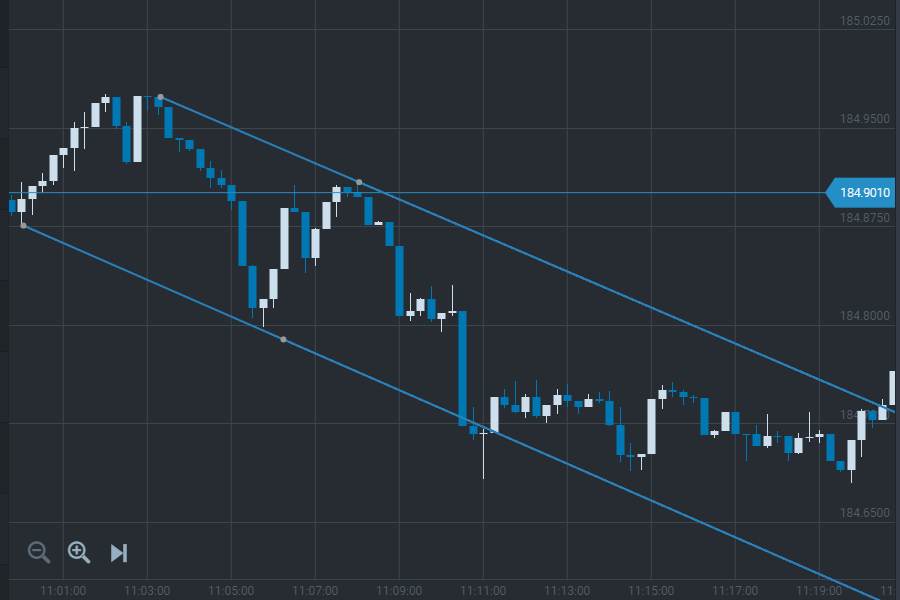
In order to see the borders of a tendency to a trend line we need to build another line parallel to the trend line, which is called a channel line. The channel line is built using one or two maximum points in an uptrend or using minimum points in a downtrend. That is the way a trend channel is formed.


You can see in the pictures that the channel lines cross the critical points of the tendency. The channel line in an uptrend is drawn along the candle shadows of the maximums and, conversely, in a downtrend, the channel line is drawn along the candle shadows of the tendency minimums. To make sure the line is drawn correctly it should be based at least on two points.


The main rule of trading in the trend channel is to buy in an uptrend and sell in the downtrend. Thus, we can see that the trend channel is essential to trade within the bounds of the existing tendency, which is limited by it.

There are also strength levels besides trend lines. A strength level is a price level in which a price movement stops or changes its direction. There two types of strength levels:


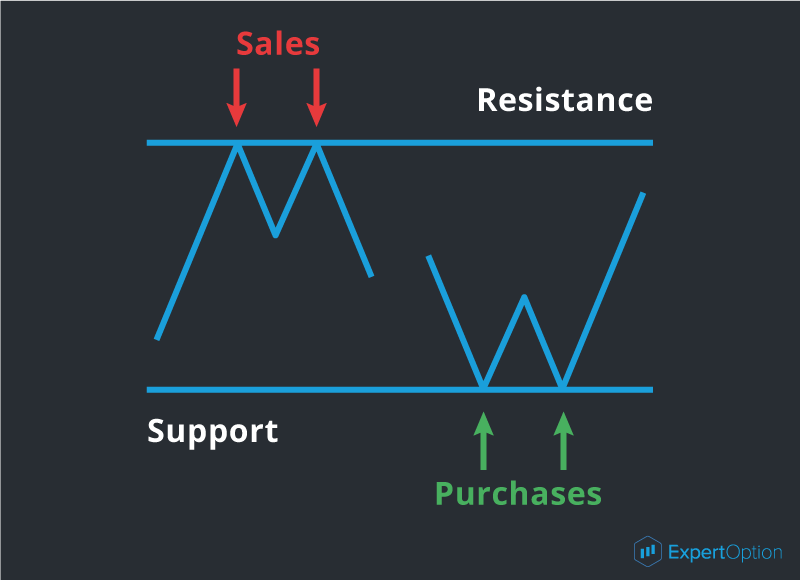
1. Resistance trend line – is a price level, which is prevented from increasing by the market participants. Simply put, if this level is reached, than everybody starts selling.

2. Support trend line – is the price level, which is prevented from decreasing by the market participants. Similarly, if this level is reached, than everybody starts buying.

Sales, Purchases


The following levels can be strength levels:

• Trend and channel lines;

• Historical level – maximum or minimum price values reached throughout the history of trading. That is to say, market remembers these levels for a long time and will immediately respond if the price reaches these levels.

• Psychological level – this level results from round price values. For example 16 000 or 16 500. As a rule this phenomena is caused by human psychology, as it is always easier to operate with round price values.

All those levels can represent resistance or support depending on whether the price is higher or lower than this level at the current moment.

Thus, we have learnt that the price movement always has its direction, which is possible to define and limit by the trend and channel lines. The duration of this movement can vary from several minutes to several months. There are also strength levels which can limit movement as well and market participants tend to make decisions basing on them. Later we are going to learn how we can use this knowledge from a practical point of view.

Saturday, 1 July 2017

Easy Technical Analysis of stocks and forex

Let's begin the game: Technical Analysis


To trade in the forex market successfully you should forecast price behavior on the chart. One of the instruments for this kind of job is technical analysis. Technical analysis is a method of price movement forecasting on the base of price movement history. Studying movement history where the price will go in future. As you may have guessed the main object of technical analysis is a currency rates history or price movement chart. The price movement chart is built on axes where the vertical axis shows a price and the horizontal axis shows time.

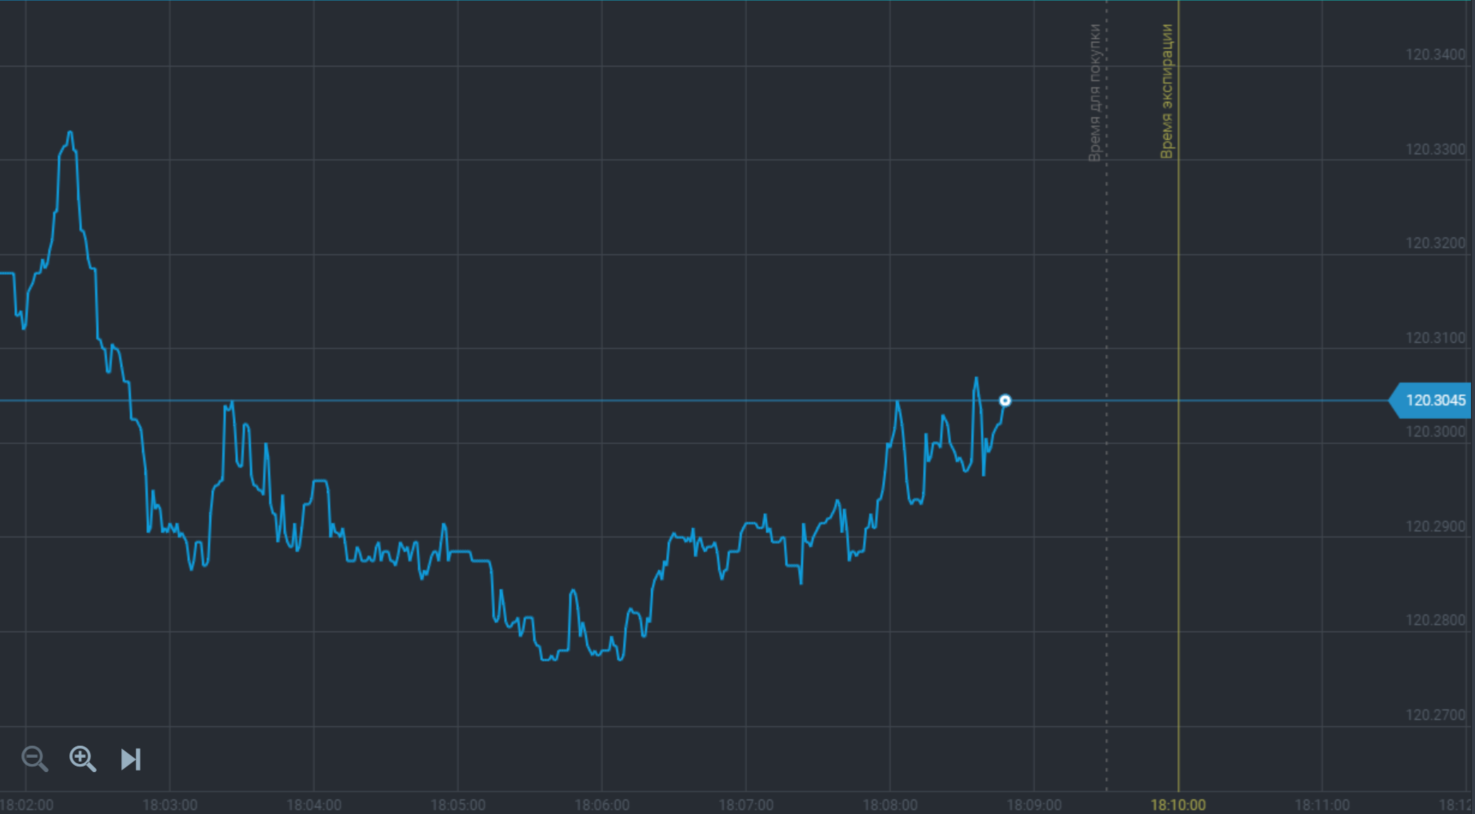
There are some price types where you can find some repeating patterns. If you have studied and remembered them you will be able to forecast charts based on building method and time intervals. At first let us review the difference of charts based on building method. The simplest one is a line chart which displays price changes in single prices connected with a line. These prices are fixed on the chart when time interval ends and each new price is connected by a line with a previous price. It looks as follows:

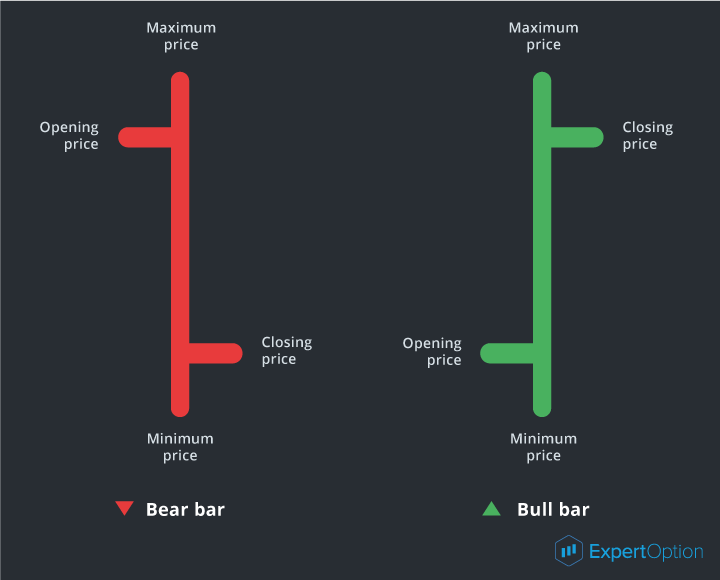
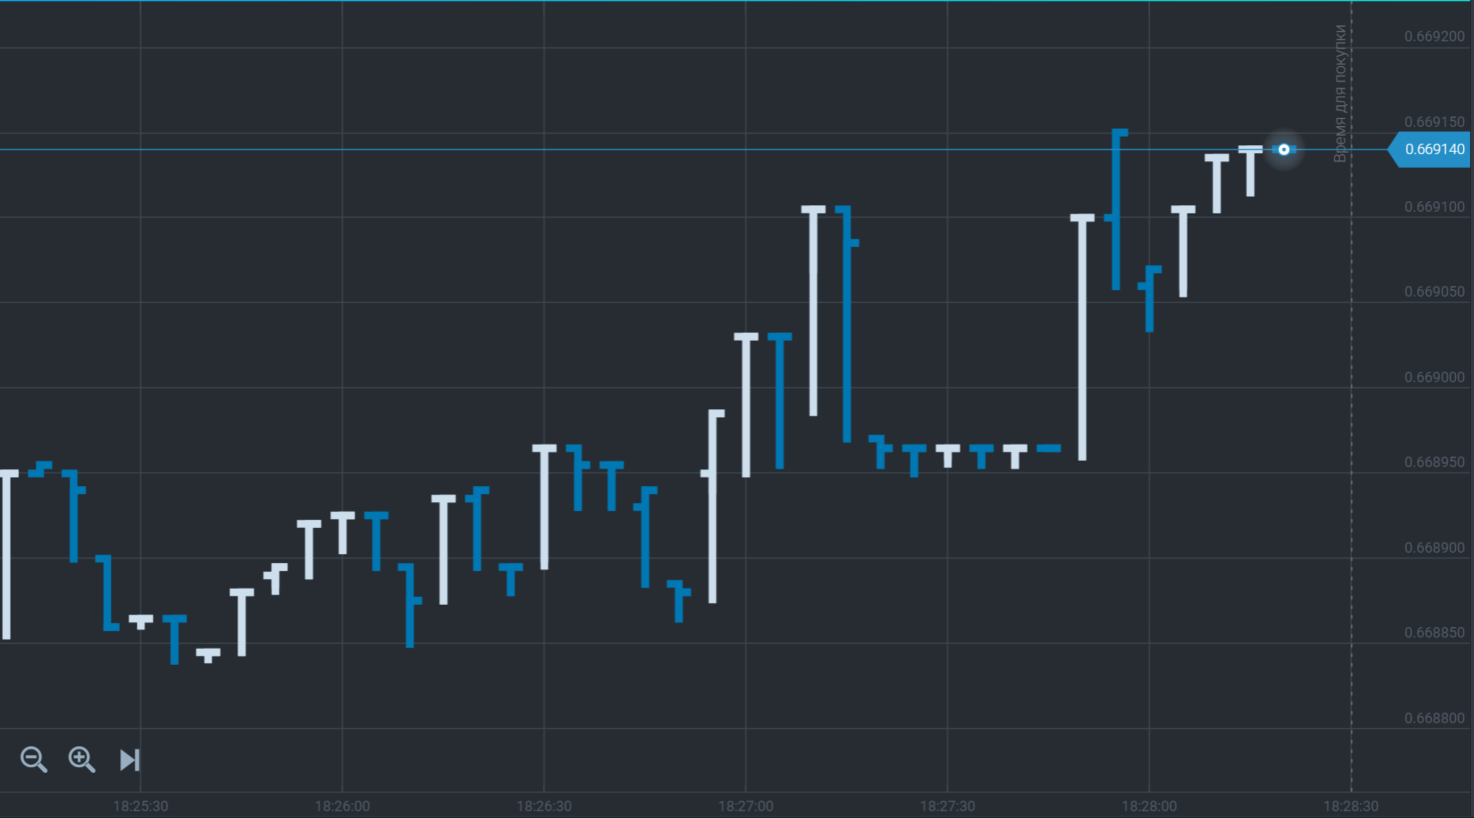
The following type is a bar chart. This chart is made of bars which show the price at the beginning of time interval (opening price), maximum and minimum prices within this period and the price at the end of time interval (closing price). Here is the example of price bars:

The bar chart looks as follows:

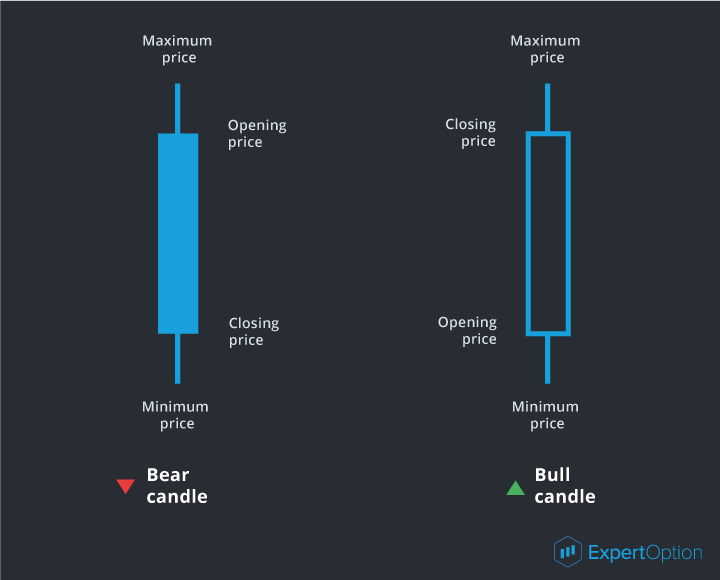
The third chart is a candlesticks chart. A candlesticks chart shows the same price information as a bar chart, but in prettier and easier format. All that because it is made of rectangles called as candlestick bars. Here is the example of candlestick bars:

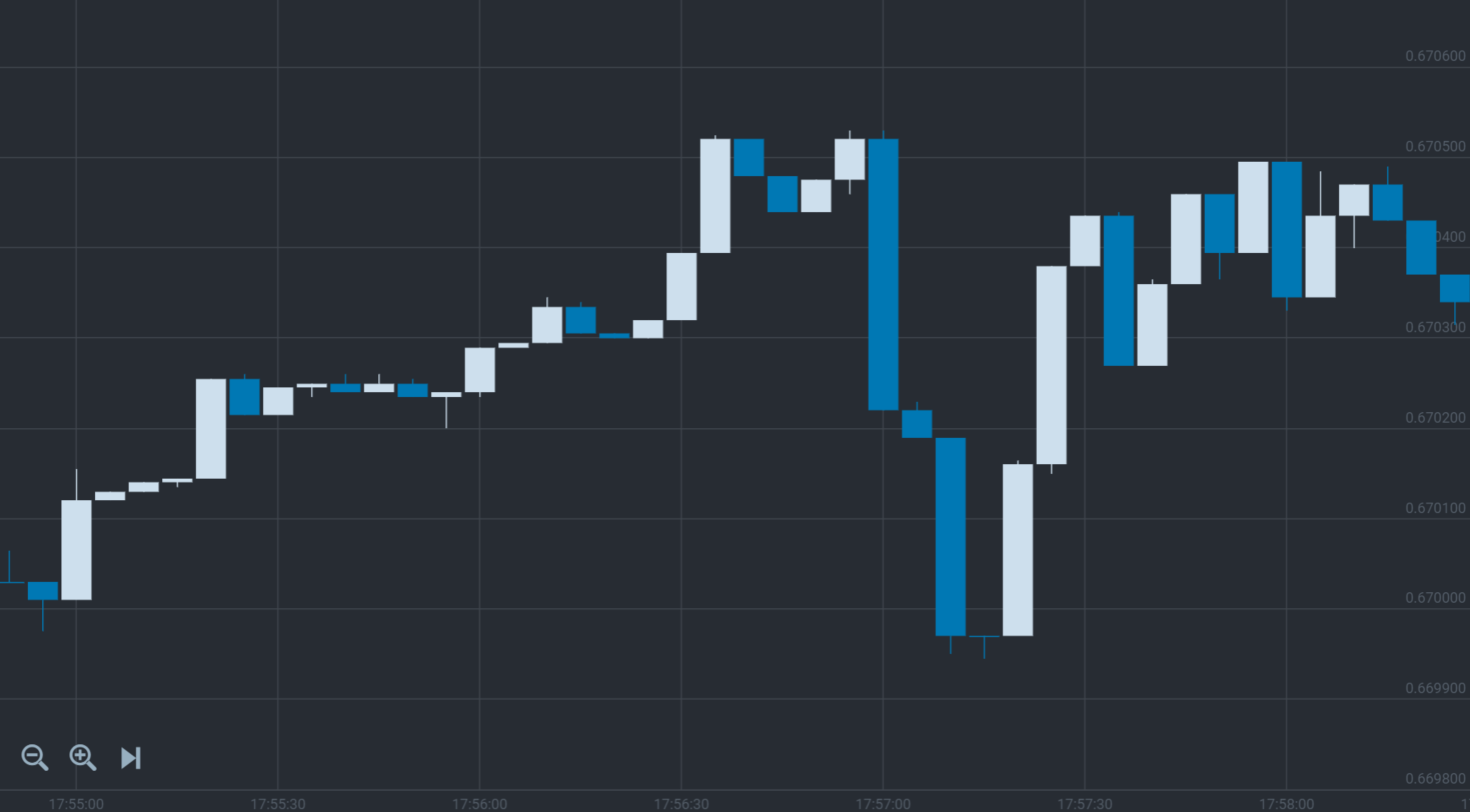
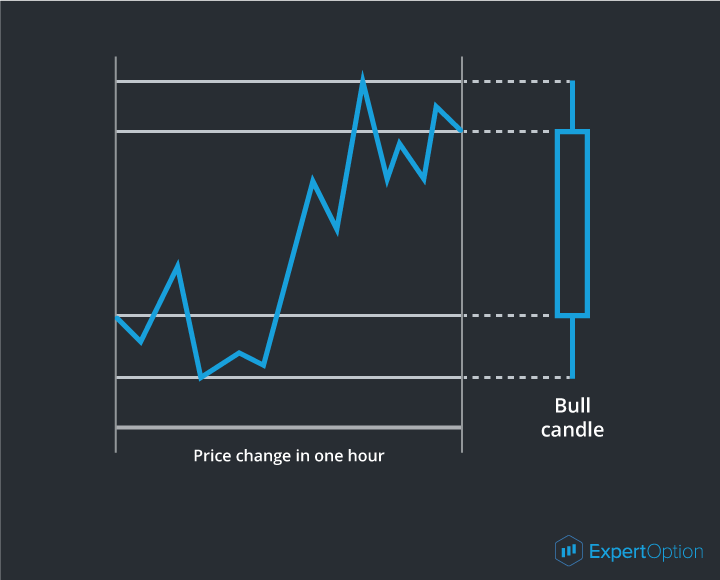
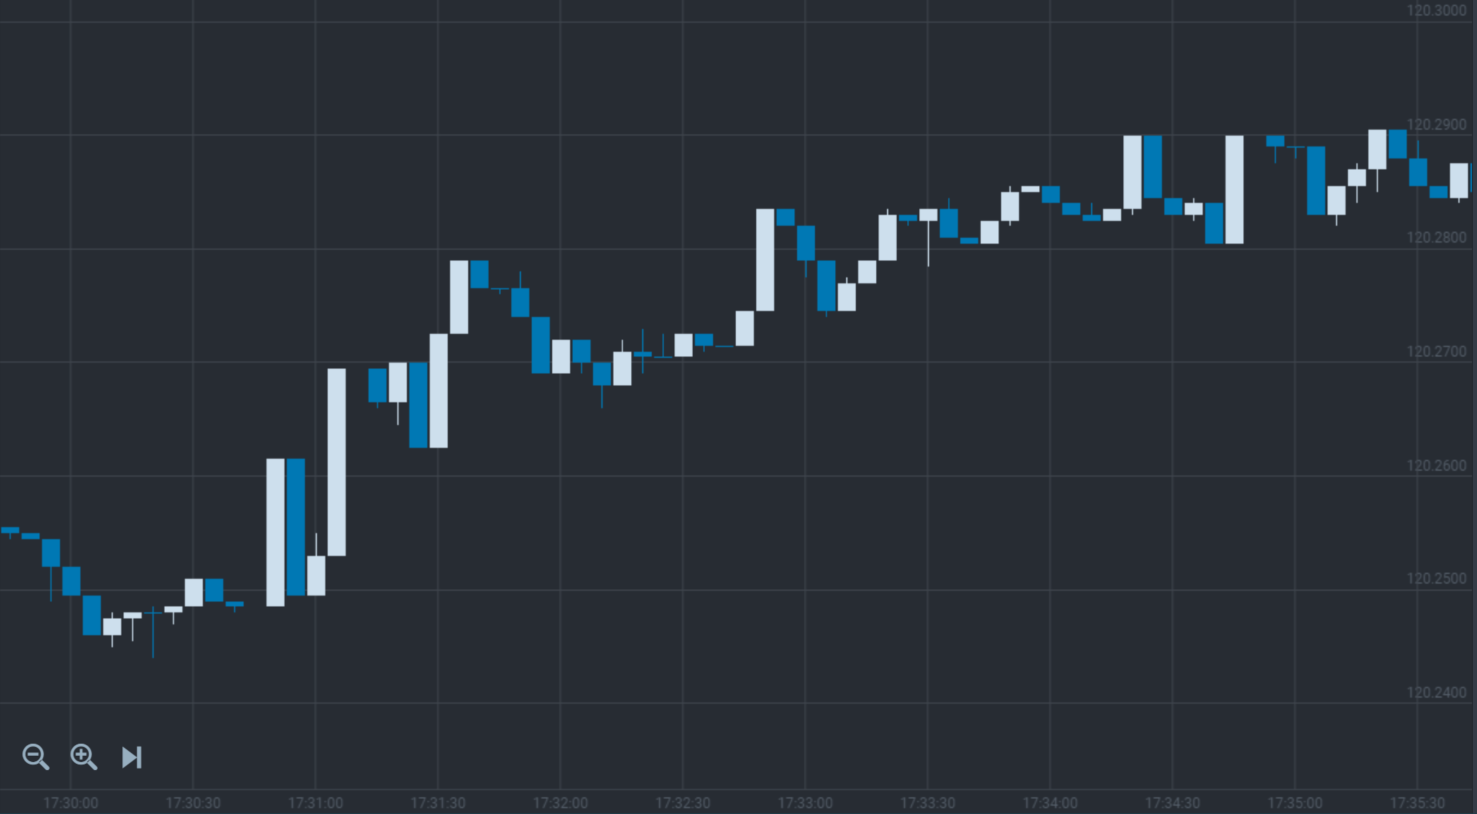
Where a bear candle indicates the price falls, and a bull candle shows the price raises. A candlesticks chart will look as follows:

So as we see, there are three types of charts: line, bar and candlesticks charts. Also the charts are recognized according to time period: 1 minute, 5 minutes, 15 minutes, 30 minutes, 1 hour, 4 hours, a day, a week and a month. Time period is the time interval when price was fixed on the chart. For example, if time interval is 1 hour, on the chart we will see a bar or candle indicating price at the beginning of an hour, maximum and minimum prices within this hour and price at the end of an hour. Here is the example:

Changing intervals of the charts you can do analysis of price history on every time intervals.

Technical Analysis is what you need


So, what the technical analysis is? The technical analysis uses charts to study the price history and find patterns. To use the price movement history for analysis we need to know three rules (axioms) of technical analysis:

1) Price moves forward – price change is always forward, whether price raises or drops, and it has its period. This axiom is a basis of tendency (trend) analysis and has the following conclusions: a current direction of price movement in the market most probably will continue rather than stop; and price will be moving in one direction until it becomes flat.

2) History repeats – if the price level was reached before it can be reached again in future. The same goes to price behavior graphical models which can appear in future with the same results as in the past. Studying the history of these price movement patterns gives us an opportunity more likely to foresee the further movement direction;

3) Price considers everything – any event affecting on currency price (political, economic and natural) is included into the price and it raises or drops depending on positive or negative affect of this event.

So thanks to basic rules of the technical analysis we can more likely forecast the price movement, determine its direction and period of this direction. It is necessary to understand that the market does not always follow the patterns found in the price movement history. Such unusual situations may happen, but with each new experience the trader will be able to find more predictable situations and make more precise estimation. For this very reason you should understand that if you have less experience you will use the most visible and prominent price movement patterns better to receive a maximum result. Technical analysis is not a science but it is more likely an art. And if a beginning trader is more attentive and hardworking he has more chances to receive a desired result.


Please refer to Section to learn more about Technical Analysis